# Quickstart

## Getting access

If you don't have access yet, NannyML Cloud is available on both the Azure and AWS marketplaces, and you can deploy it in two different ways, depending on your needs.

* **Managed Application:** With the Managed application, no data will leave your environment. This option will provision the NannyML Cloud components and the required infrastructure within your own Azure or AWS subscription. To learn more about this, check out the docs on how to set up NannyML Cloud on [Azure](https://docs.nannyml.com/cloud/deployment/azure/azure-managed-application) and [AWS](https://docs.nannyml.com/cloud/deployment/aws).
* **Software-as-a-Service (SaaS):** With the SaaS option, you send us the monitoring data, and the monitoring happens in our own infrastructure. To learn more about this, check out the docs on how to set up NannyML Cloud on [Azure](https://docs.nannyml.com/cloud/deployment/azure/azure-software-as-a-service-saas) and [AWS](https://docs.nannyml.com/cloud/deployment/aws).

<table data-card-size="large" data-view="cards" data-full-width="false"><thead><tr><th></th><th data-hidden data-card-target data-type="content-ref"></th><th data-hidden data-card-cover data-type="files"></th></tr></thead><tbody><tr><td>Azure Marketplace: NannyML Cloud ↗</td><td><a href="https://azuremarketplace.microsoft.com/en-us/marketplace/apps?search=nannyml&#x26;page=1">https://azuremarketplace.microsoft.com/en-us/marketplace/apps?search=nannyml&#x26;page=1</a></td><td><a href="https://content.gitbook.com/content/2wXpsFdZLc0Ed8e18KiO/blobs/TNYwkjCyCTFM3UOn2mRa/Twitter%20post%20-%201.jpg">Twitter post - 1.jpg</a></td></tr><tr><td>AWS Marketplace: NannyML Cloud ↗</td><td><a href="https://aws.amazon.com/marketplace/pp/prodview-rtikbsvzcelcg?sr=0-3&#x26;ref_=beagle&#x26;applicationId=AWSMPContessa">https://aws.amazon.com/marketplace/pp/prodview-rtikbsvzcelcg?sr=0-3&#x26;ref_=beagle&#x26;applicationId=AWSMPContessa</a></td><td><a href="https://content.gitbook.com/content/2wXpsFdZLc0Ed8e18KiO/blobs/w19Irv6SbKbpQf84X9jG/Twitter%20post%20-%202.jpg">Twitter post - 2.jpg</a></td></tr></tbody></table>

## Monitoring a classification model

If you prefer a video walkthrough, here's our Quickstart YouTube guide:

{% embed url="<https://youtu.be/5mqt10Q0snQ>" %}

### Hotel booking prediction model

The dataset comes from two hotels in Portugal and has 30 features describing the booking entry. To learn more about this data, check out the [hotel booking demand dataset](https://www.sciencedirect.com/science/article/pii/S2352340918315191). After simple preprocessing, we trained the model to predict whether the booking would be canceled or not, with the final result of 0.87 ROC AUC on a test set.

To monitor the model in production, we created reference and analysis sets. NannyML uses the reference set to establish a baseline for model performance and shift detection. The test set is an ideal candidate to serve as a reference. The analysis set is the production data - NannyML checks if the model maintains performance or if there's a concept or covariate shift.

{% hint style="info" %}
Note that analysis data is sometimes referred to as monitored data.
{% endhint %}

Let's add our model:

{% tabs %}
{% tab title="NannyML Cloud UI" %}

1. Click on the **Add New Model** button in the navigation bar.
2. Complete the new model setup configuration.

<figure><img src="https://content.gitbook.com/content/2wXpsFdZLc0Ed8e18KiO/blobs/VzZUlQSDs7KfhnzWoCnD/Screen%20Shot%202024-07-23%20at%2012.38.31%20PM.png" alt=""><figcaption><p>
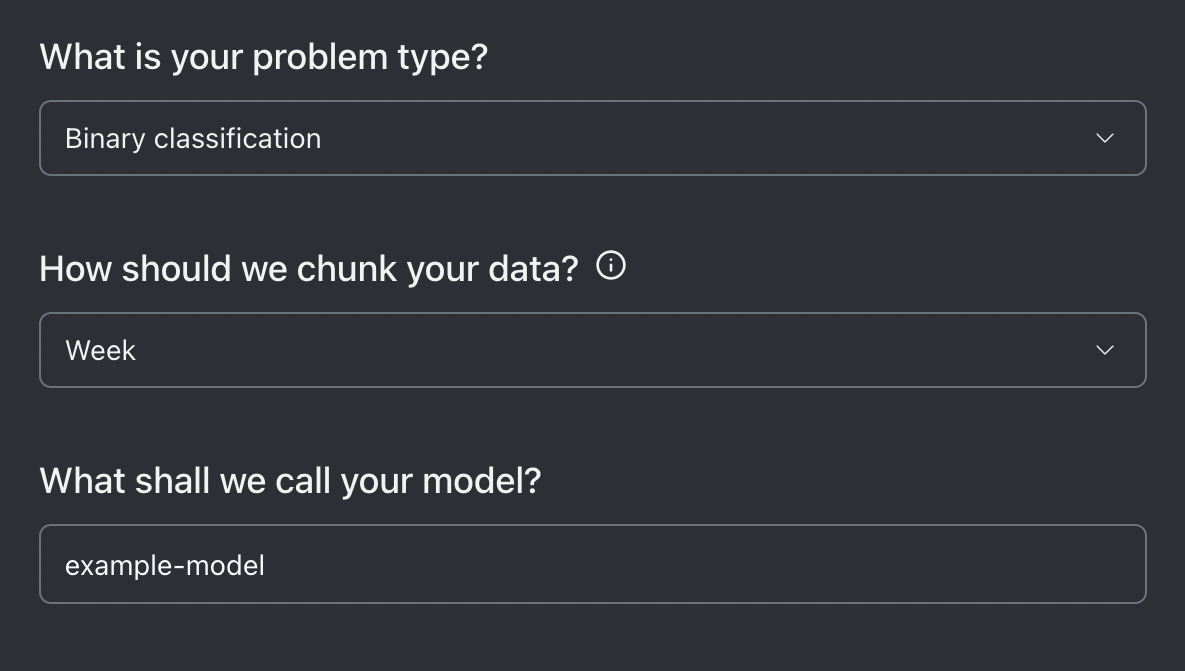
New model configuration setup.
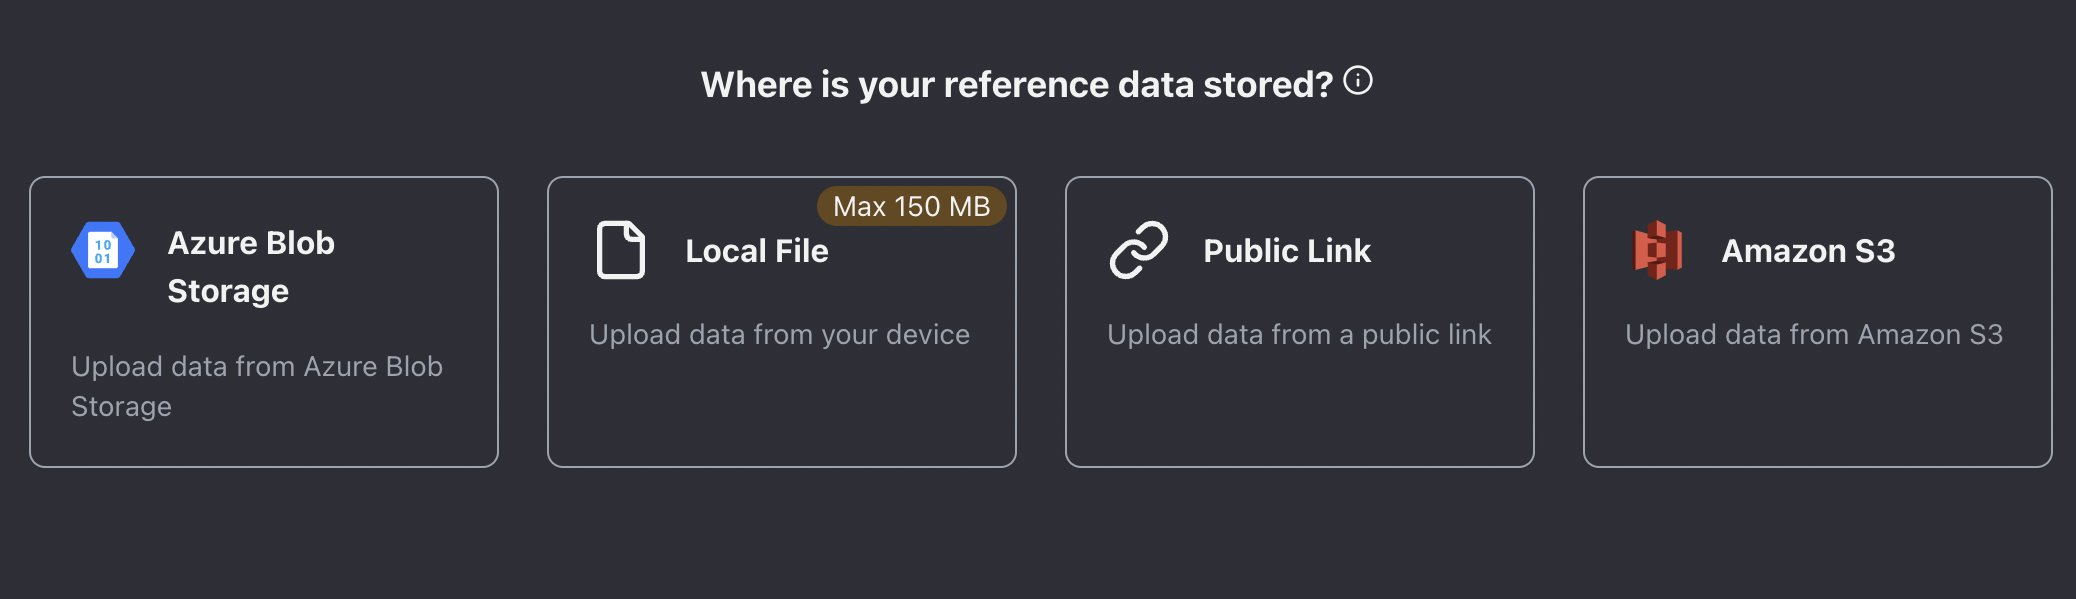
</p></figcaption></figure>

3. Upload the reference dataset by choosing one of the available upload methods (see image below). For this example, we will use the following links:
   1. **Reference dataset link -** `https://raw.githubusercontent.com/NannyML/sample_datasets/main/hotel_booking_dataset/hotel_booking_reference_march.csv`
   2. **Analysis dataset link** - `https://raw.githubusercontent.com/NannyML/sample_datasets/main/hotel_booking_dataset/hotel_booking_analysis_march.csv`

<figure><img src="https://content.gitbook.com/content/2wXpsFdZLc0Ed8e18KiO/blobs/gPTmUrj61qDod2SCrDNM/Screen%20Shot%202024-07-23%20at%2012.32.42%20PM.png" alt="Data upload options"><figcaption><p>Data upload options</p></figcaption></figure>

4. Configure the reference dataset. The uploaded reference data contains the following:

   1. **Timestamp** - the information when the booking was made. The reference data spans from May to September 2016, while the analysis data covers October 2016 to August 2017.
   2. **Identifier** - a unique identifier for each row in the dataset.
   3. **Target** - ground truth/labels. In this example, the target is whether a booking is canceled or not. Notice that the target is not available in the analysis set. In this way, we simulate a real-world scenario where the ground truth is only available after some time.
   4. **Predictions** - the predicted class. Whether the booking will get canceled or not
   5. **Predicted probability** - the model scores outputted by the model.
   6. **Model inputs** - 27 features about hotel booking, including booking like customer's country of origin, age, children, etc.

   Optionally indicate the columns you wish to use for segmentation. This can be done by selecting specific columns using the **Segment by** dropdown menu or by selecting the **Segment by** flag for specific columns.

<figure><img src="https://content.gitbook.com/content/2wXpsFdZLc0Ed8e18KiO/blobs/8dn3DzRZJ4LpjC1HbmTr/Screen%20Shot%202024-07-23%20at%2012.36.48%20PM.png" alt=""><figcaption><p>
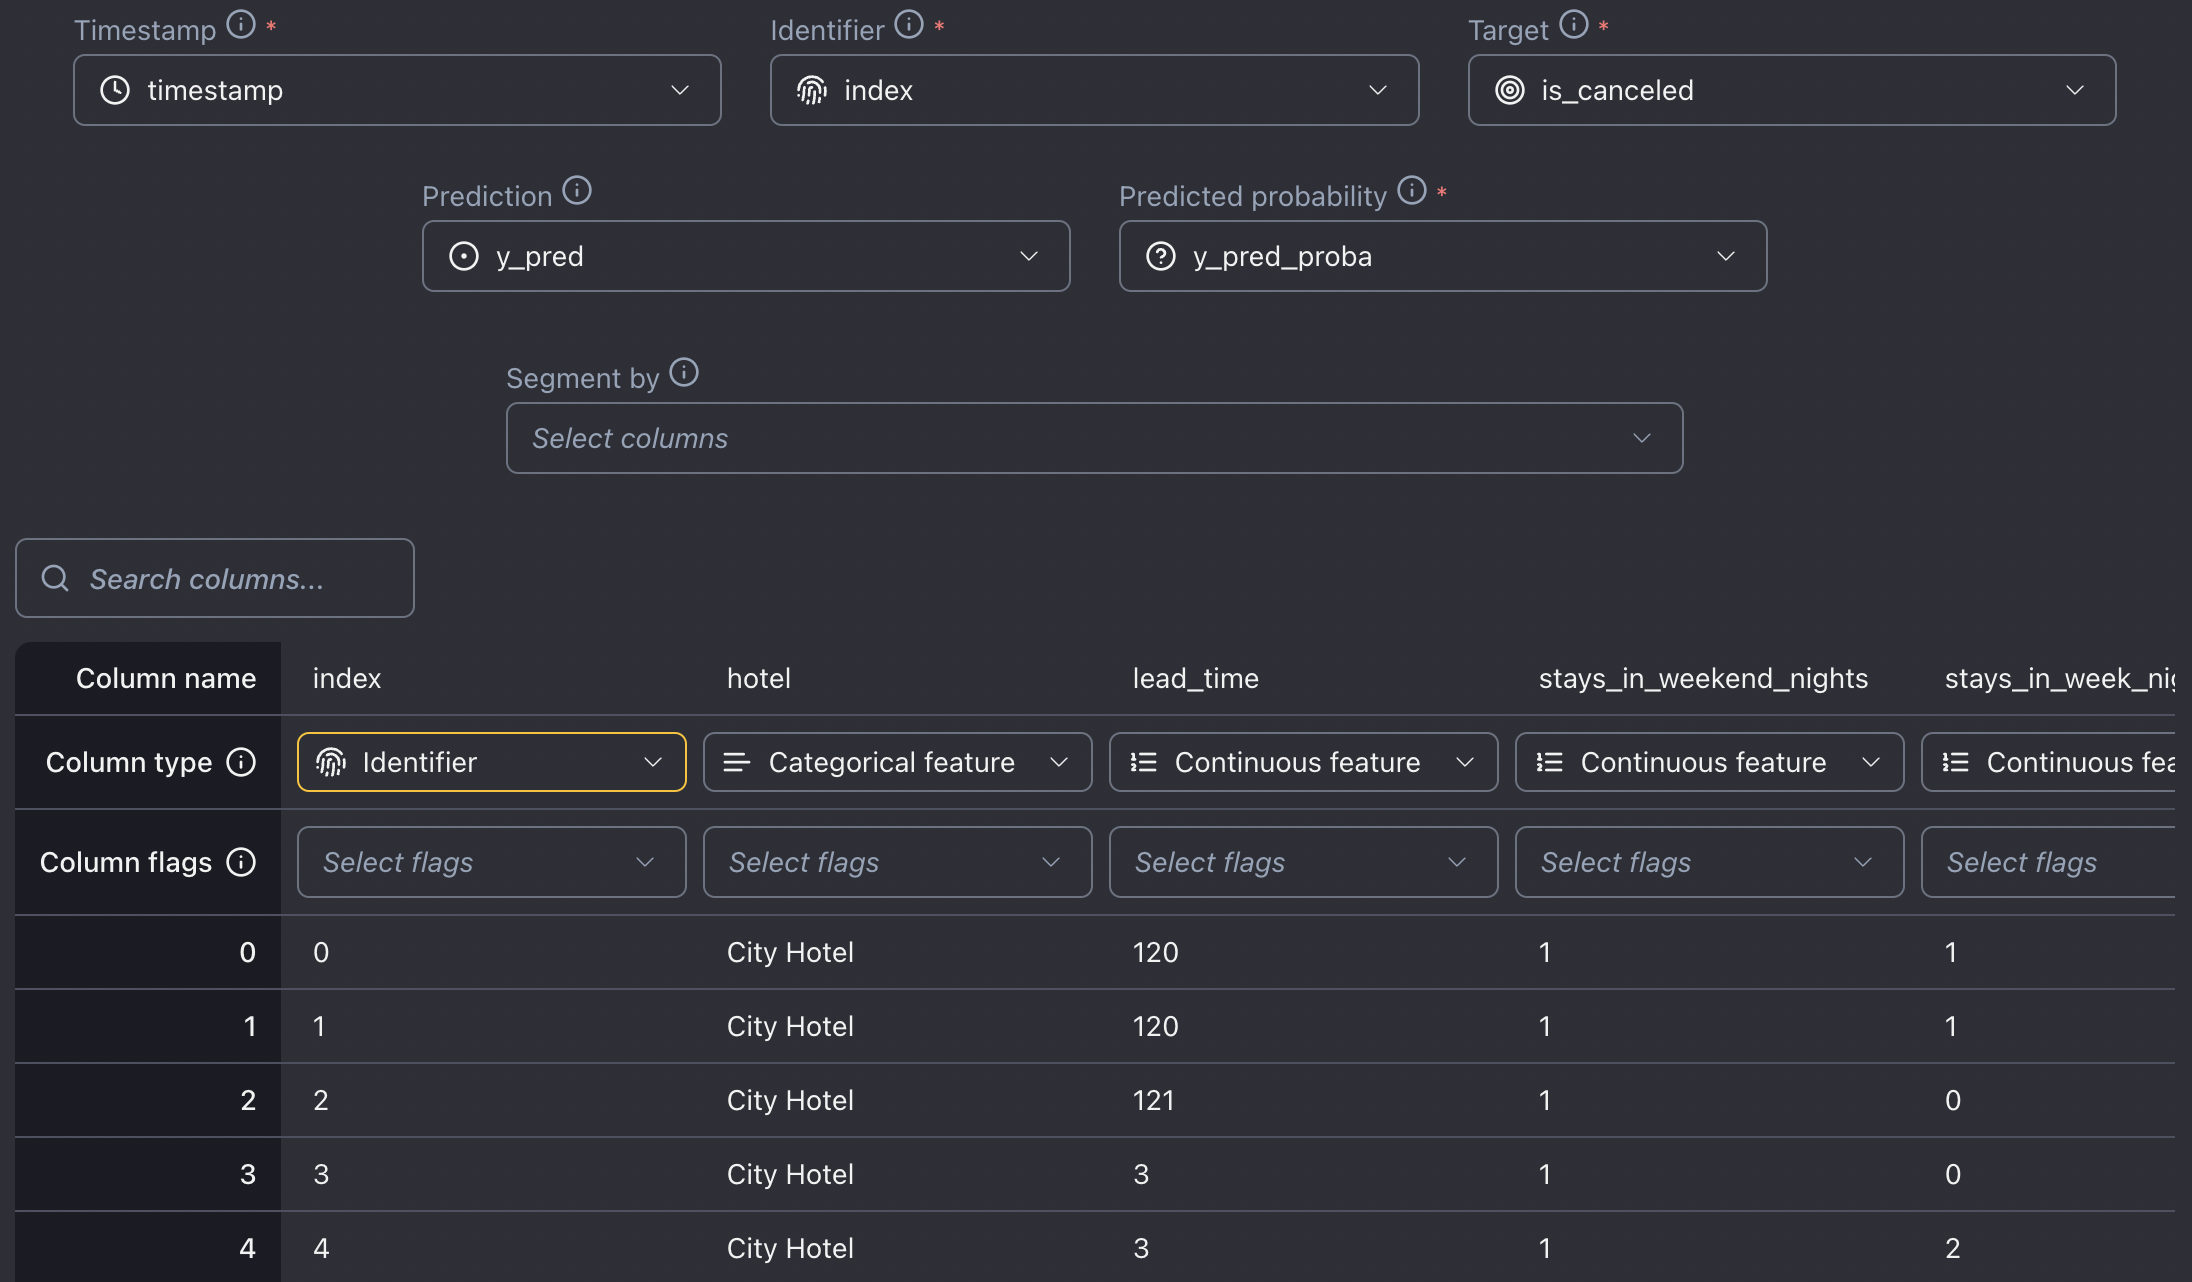
Reference dataset setup</p></figcaption></figure>

5. Upload the analysis data in the same way you uploaded the reference dataset.
6. Next, upload the target data if it is available (in our working example, we don't have access to target data).

<figure><img src="https://content.gitbook.com/content/2wXpsFdZLc0Ed8e18KiO/blobs/QV73OcCVgfax0pcOuNfO/Screen%20Shot%202024-07-23%20at%2012.37.16%20PM.png" alt=""><figcaption><p>
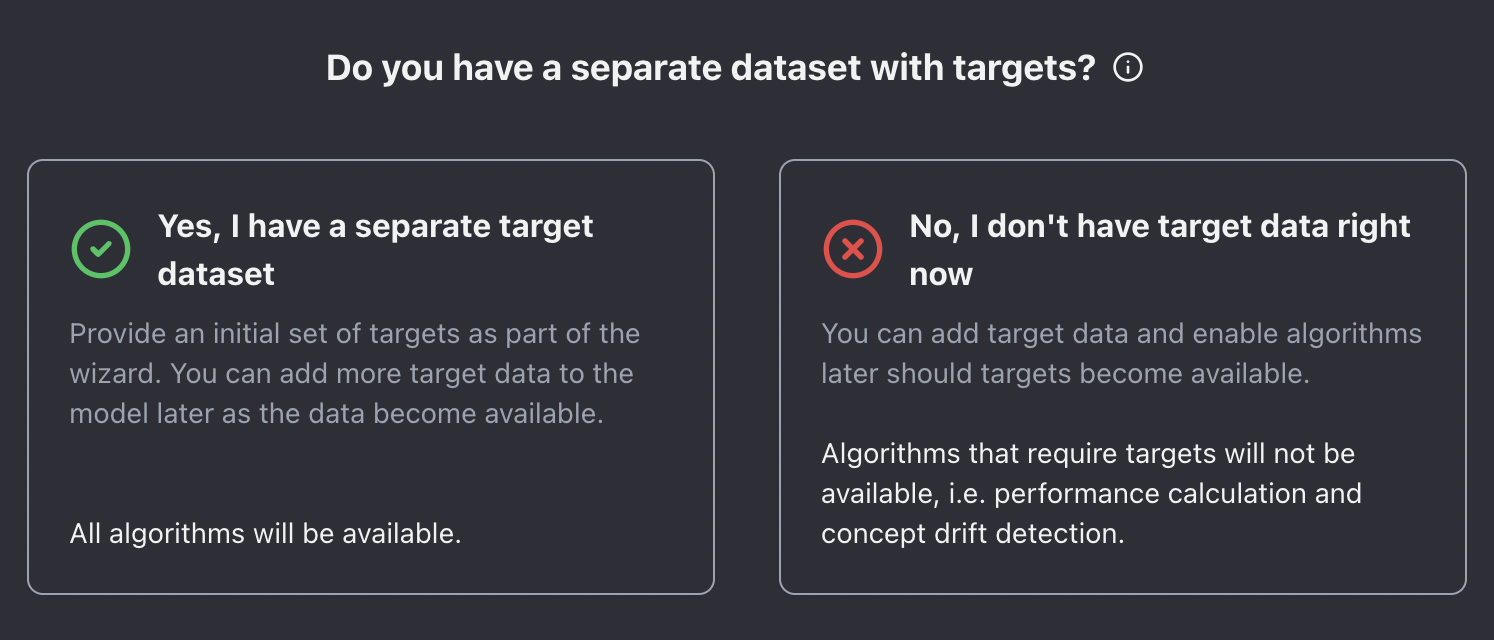
Upload target data if available
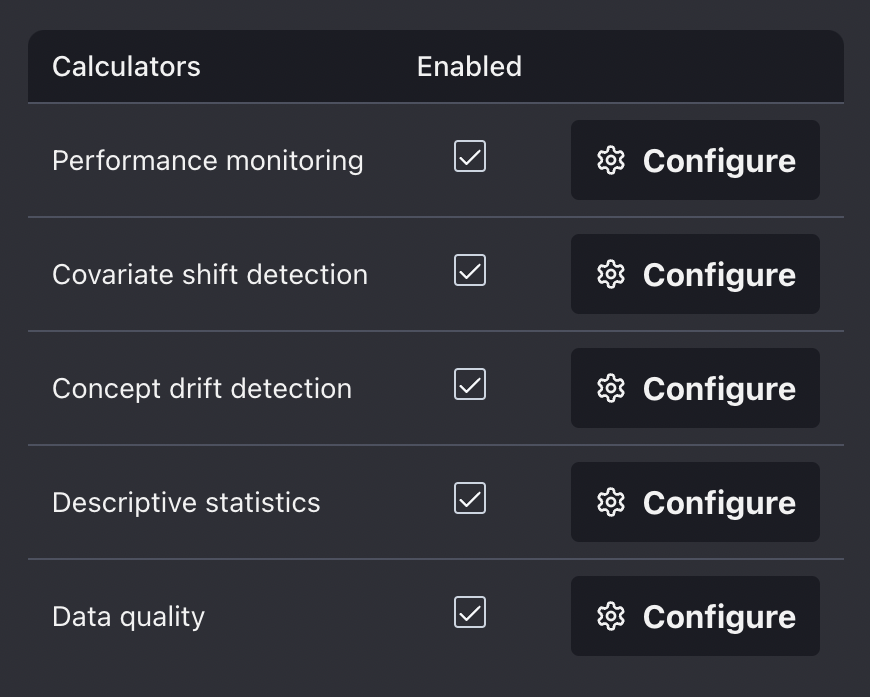
</p></figcaption></figure>

7. Configure the metrics you wish to evaluate.

<figure><img src="https://content.gitbook.com/content/2wXpsFdZLc0Ed8e18KiO/blobs/M8qScCSEgKmCFrSZ3UQa/Screen%20Shot%202024-07-23%20at%2012.37.38%20PM.png" alt=""><figcaption><p>Metrics</p></figcaption></figure>

8. Finally, review and upload the model.
   {% endtab %}

{% tab title="NannyML Cloud SDK" %}
To get started, simply follow the initial steps outlined in the [SDK documentation](https://docs.nannyml.com/cloud/nannyml-cloud-sdk/getting-started). This will guide you through installing the SDK library and obtaining the NannyML Cloud URL and API Token.

After successful installation, create a Python script, import the SDK and Pandas library, and add the credentials.

{% hint style="info" %}
For demonstration purposes, we recommend using a Jupyter or Colab notebook to upload data with the SDK instead of a Python script.
{% endhint %}

```python
import pandas as pd
import nannyml_cloud_sdk as nml_sdk

nml_sdk.url = "your instance URL goes here eg; https://beta.app.nannyml.com"
nml_sdk.api_token = r"api token goes here"
```

Now, we will load reference and analysis data.

```python
reference_data = pd.read_csv("https://raw.githubusercontent.com/NannyML/sample_datasets/main/hotel_booking_dataset/hotel_booking_reference.csv")
analysis_data = pd.read_csv("https://raw.githubusercontent.com/NannyML/sample_datasets/main/hotel_booking_dataset/hotel_booking_analysis_march.csv")
```

We can now use the [Schema](https://nannyml.github.io/nannyml-cloud-sdk/api_reference/model/) class together with the `from_df()` method to configure the schema of the model.

```python
schema = nml_sdk.Schema.from_df(
    'BINARY_CLASSIFICATION',
    reference_data,
    target_column_name='is_canceled',
    identifier_column_name = 'Index',
)
```

Then, we create a new model by using the `Model.create()` method. Where we can set chunk period to monthly, and accuracy as the main monitoring performance metric.

```python
model = nml_sdk.Model.create(
    name='Hotel Booking SDK upload',
    schema=schema,
    chunk_period='MONTHLY',
    reference_data=reference_data,
    analysis_data=analysis_data,
    target_data=pd.DataFrame(columns=["Index", "is_canceled"]),
    main_performance_metric='ACCURACY',
)
```

And voila, the model should now be available in your Model Overview dashboard! 🚀
{% endtab %}
{% endtabs %}

## Estimated performance

ML models are deployed to production once their performance has been validated and tested. This usually takes place in the model development phase. The main goal of ML model monitoring is to continuously verify whether the model maintains its anticipated performance (which is not the case most of the time).

Monitoring performance is relatively straightforward when targets are available, but in many use cases like demand forecasting or insurance pricing, the labels are delayed, costly, or impossible to get. In such scenarios, estimating performance is the only way to verify if the model is still working properly.

Let's see the estimated performance of our model on the summary page. The model summary shows signs of performance degradation in the last chunks of performance estimation.

<figure><img src="https://content.gitbook.com/content/2wXpsFdZLc0Ed8e18KiO/blobs/XYTWBo7m3NDDEXj0F0HG/model_overview.png" alt=""><figcaption><p>
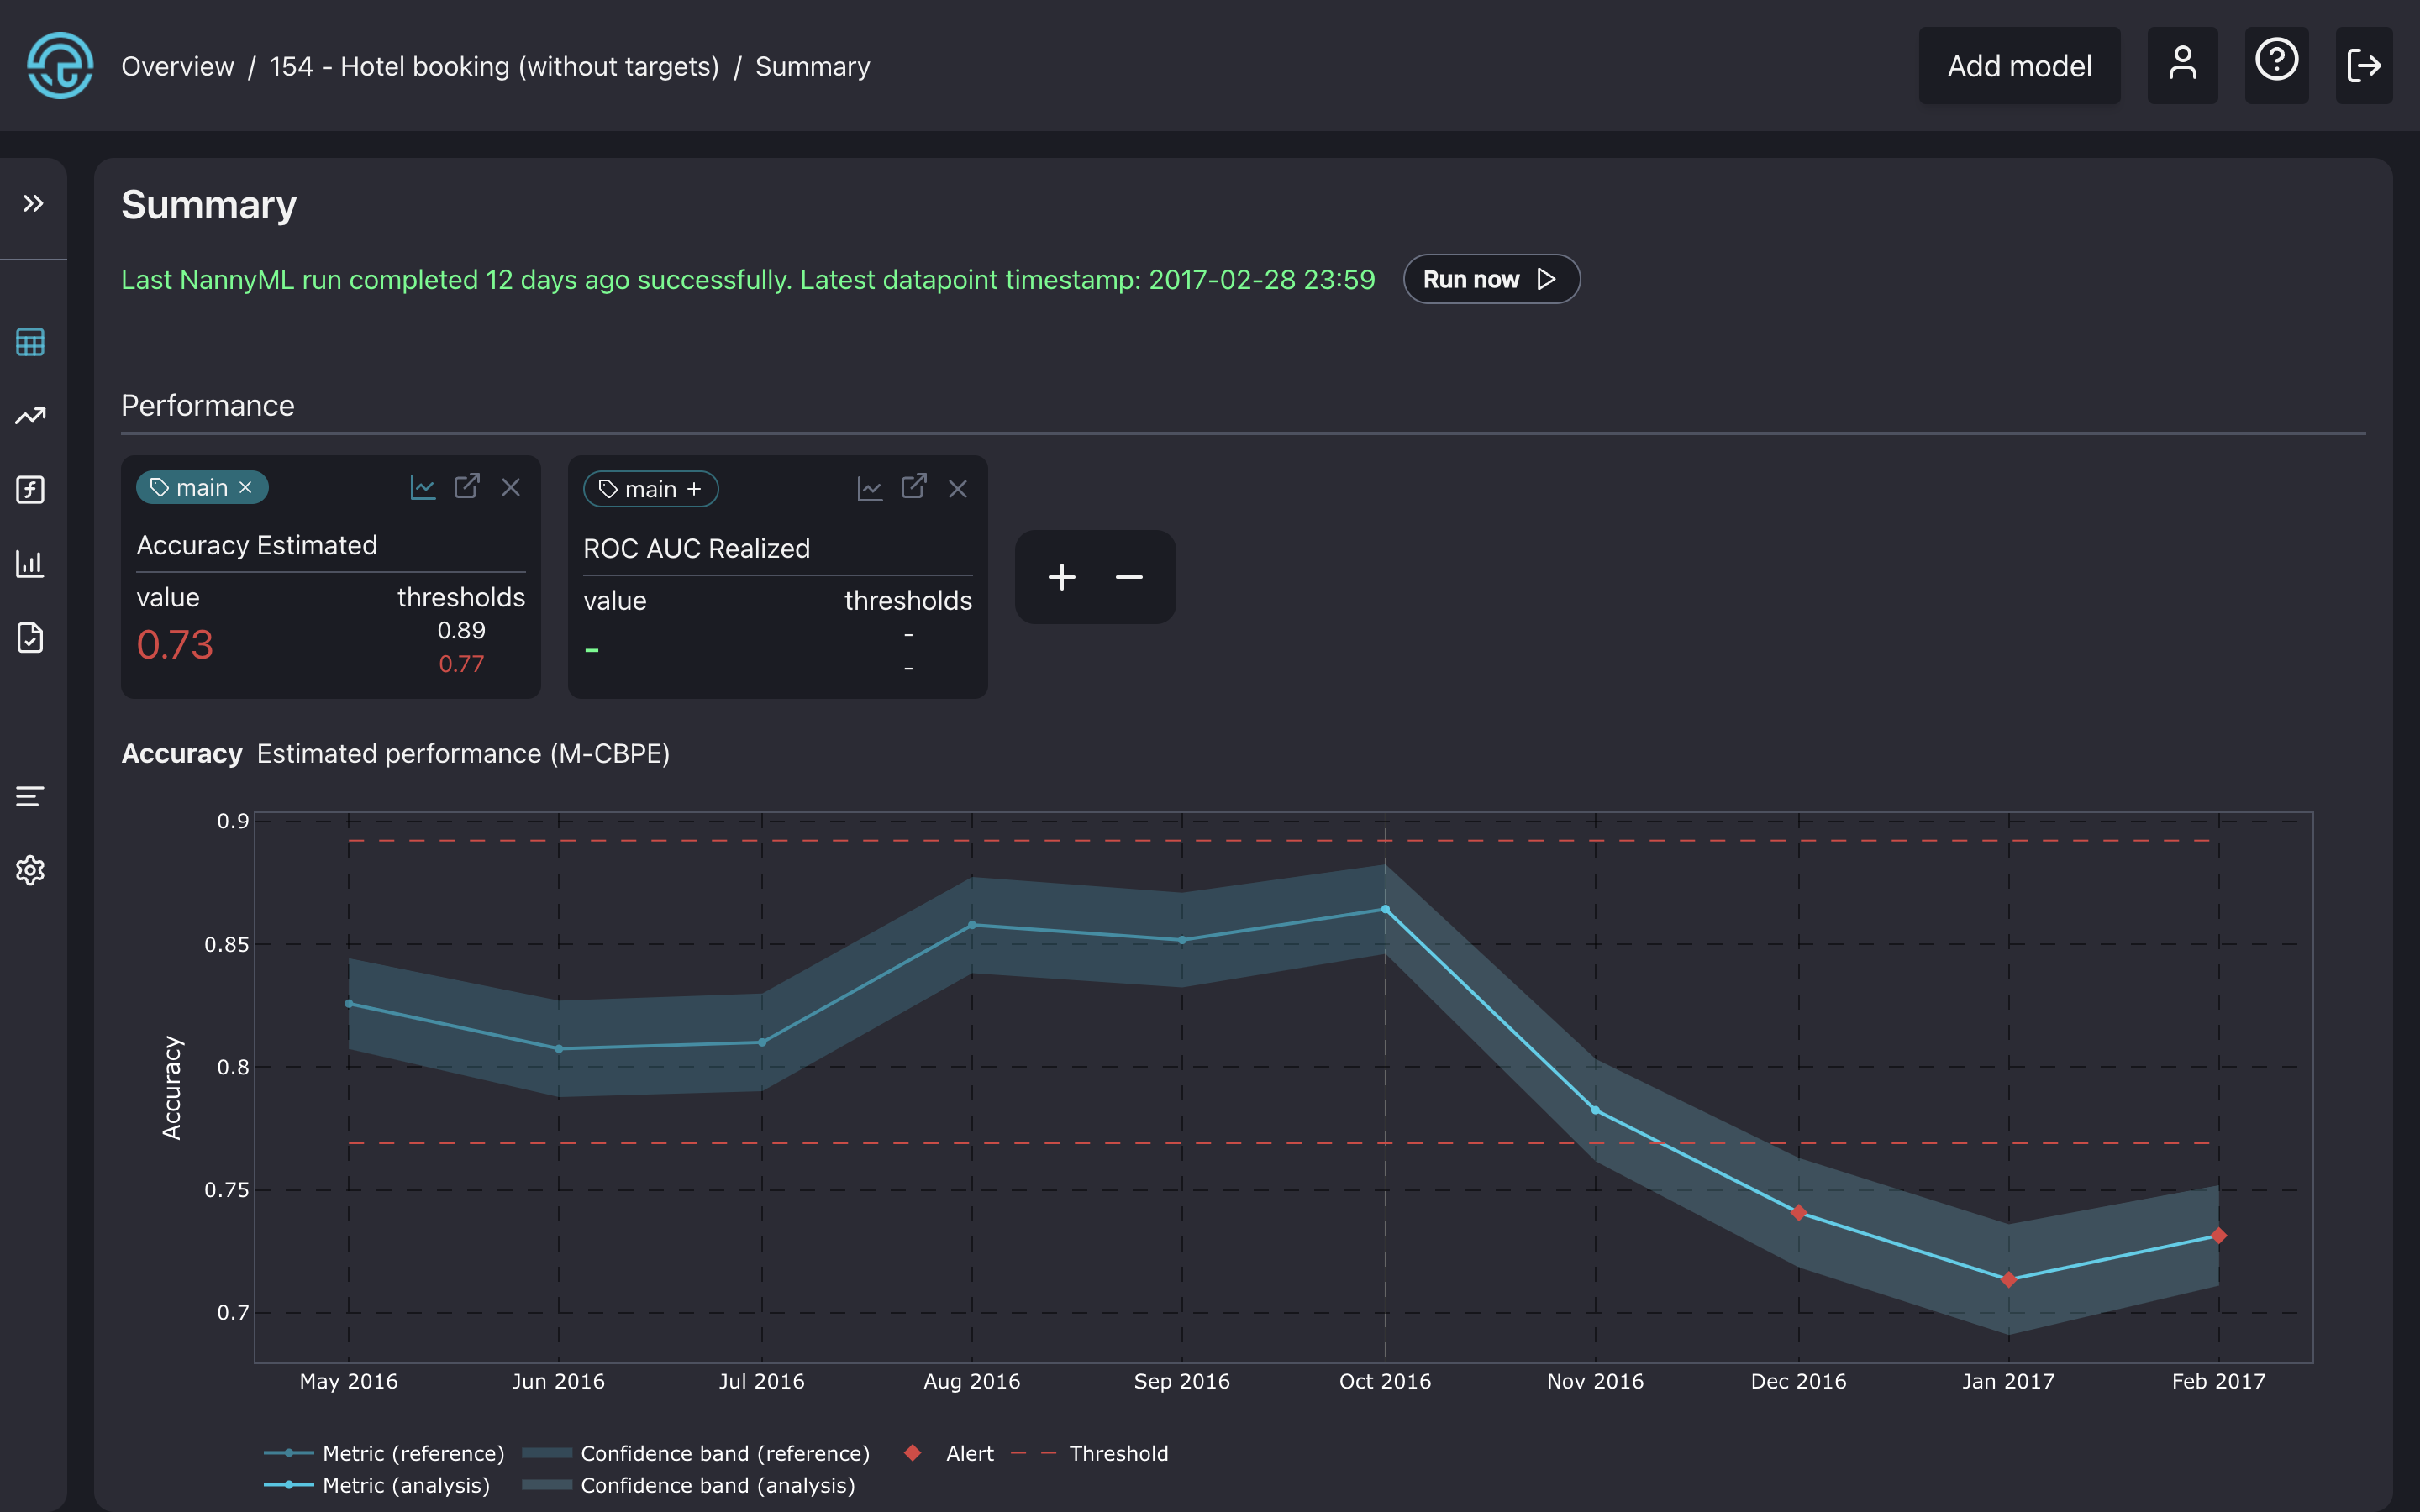
The accuracy plot in the model summary page.</p></figcaption></figure>

Also, the PCA reconstruction error from the multivariate drift detection method seems to be higher than the given thresholds.

<figure><img src="https://content.gitbook.com/content/2wXpsFdZLc0Ed8e18KiO/blobs/KsKD9yGR5295dknywcRS/quickstart_pca.png" alt=""><figcaption><p>
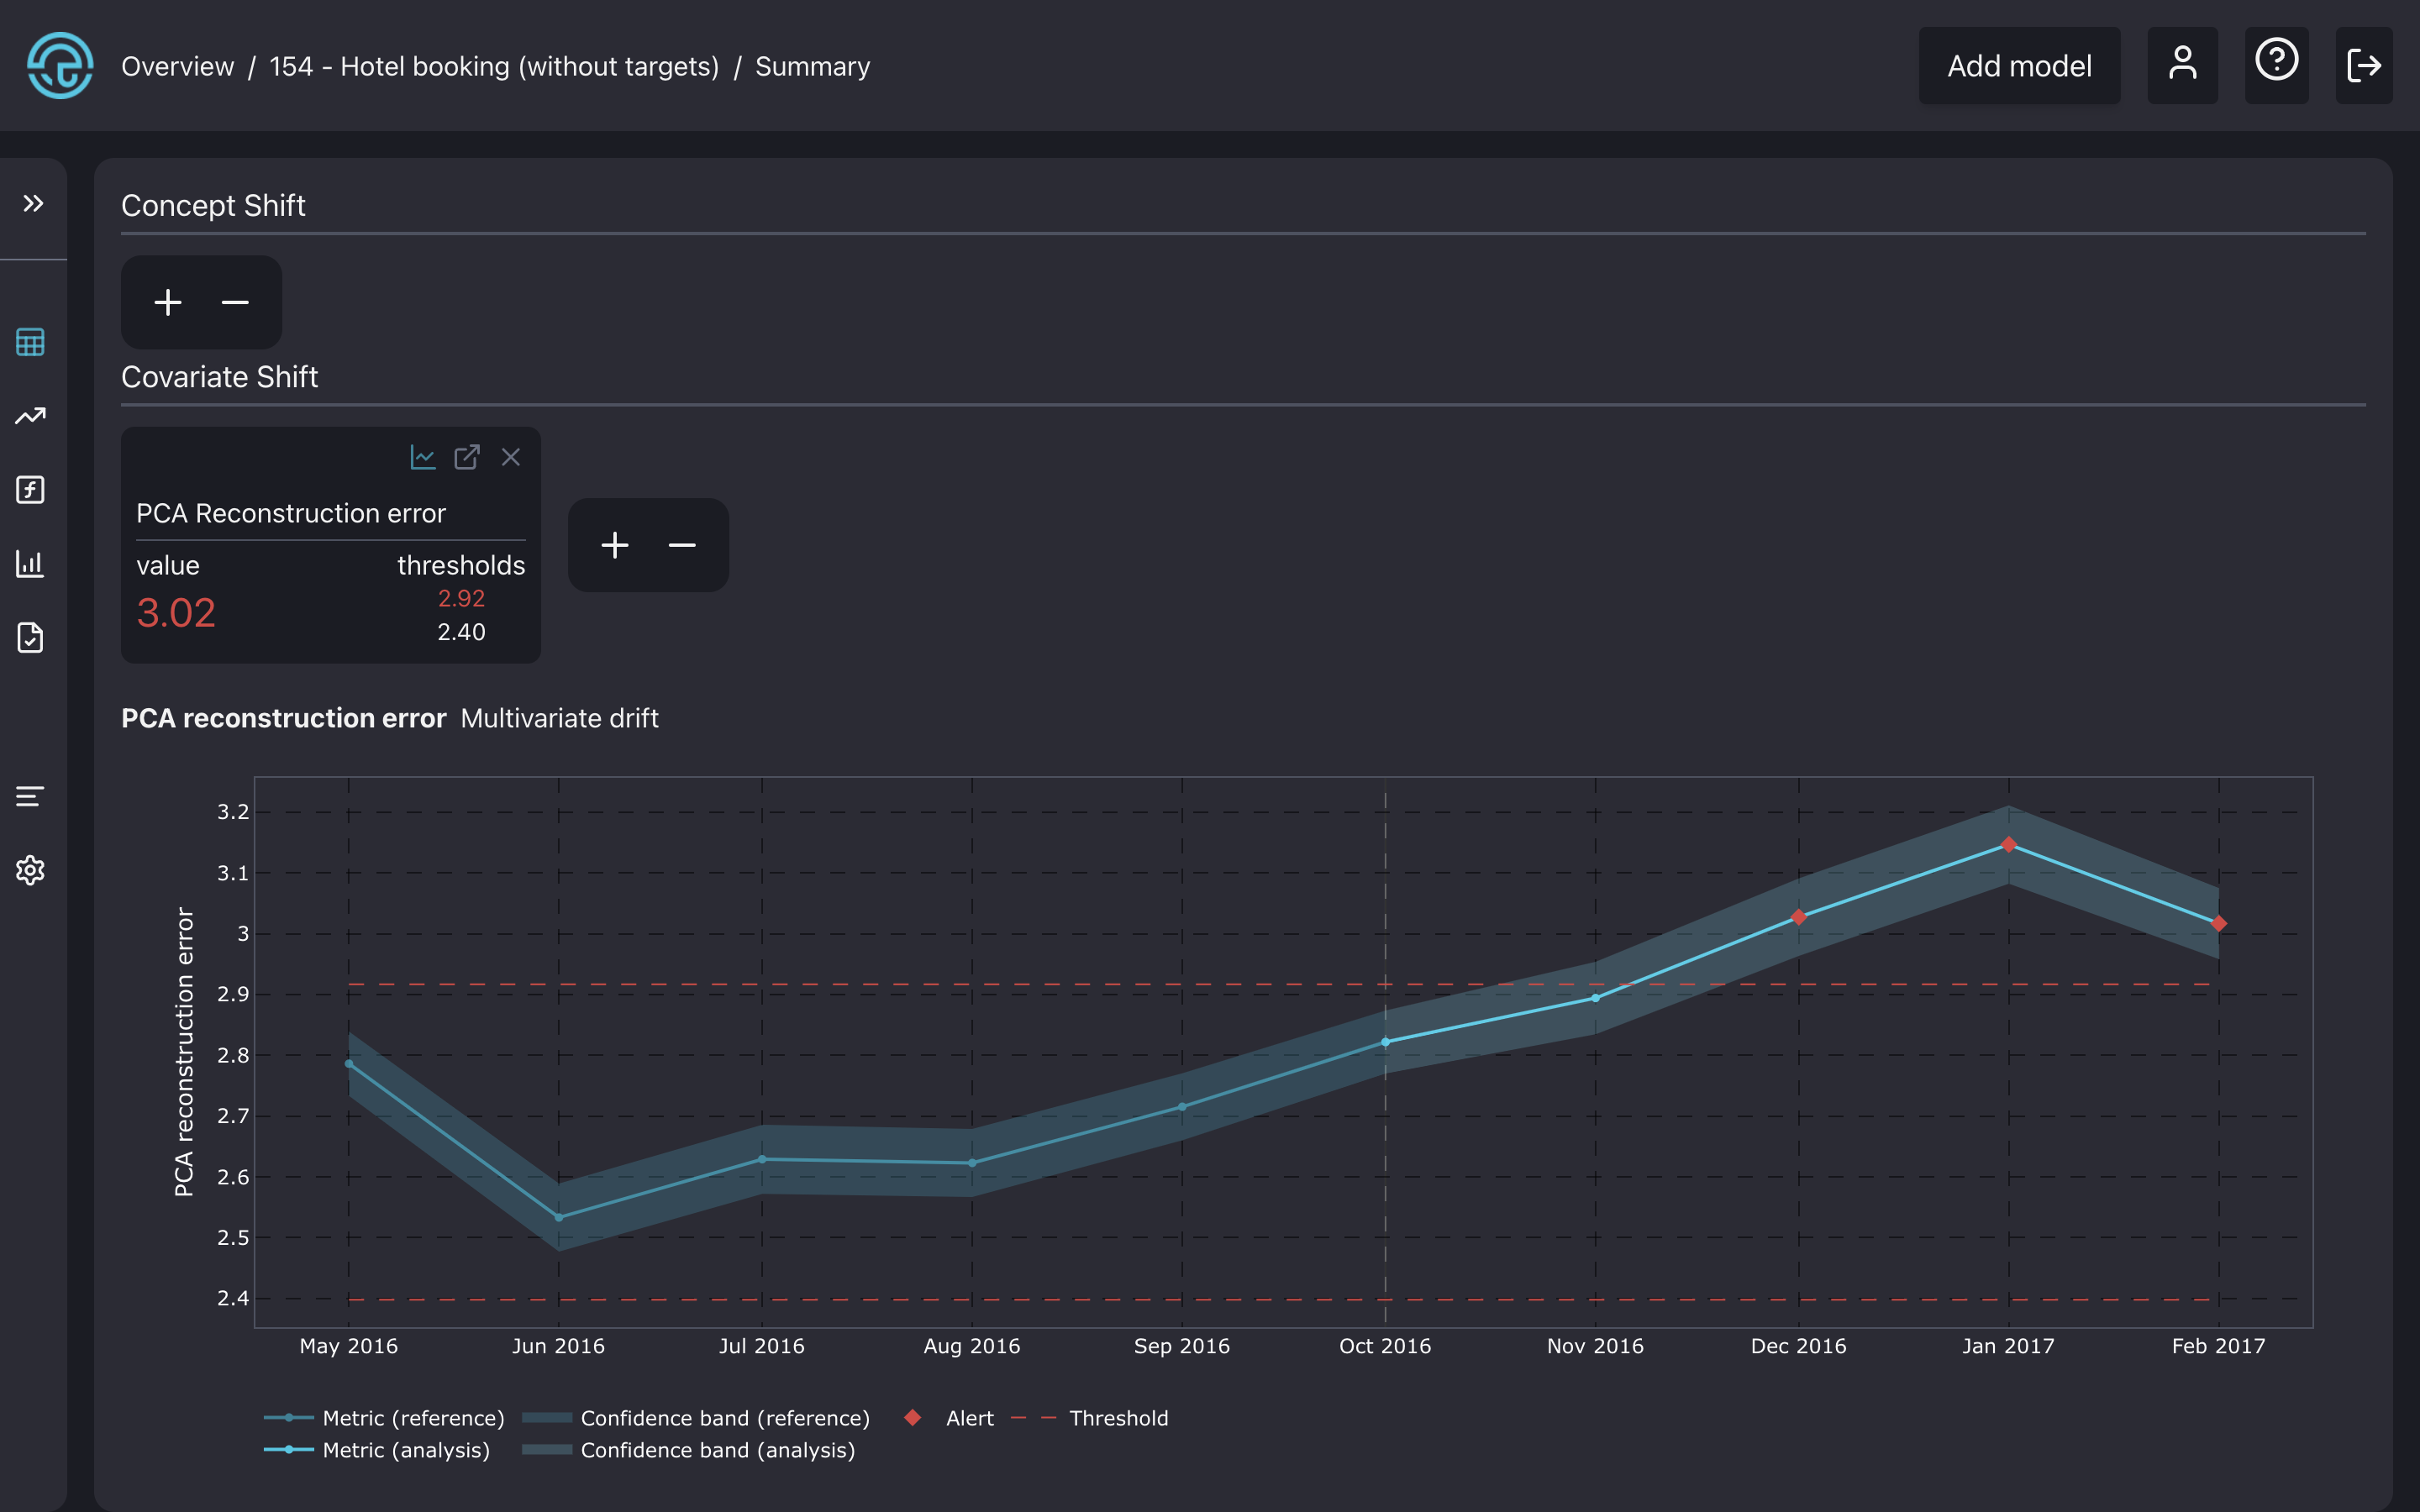
The PCA reconstruction error plot in the model summary page.</p></figcaption></figure>

{% hint style="info" %}
Notice that concept shift detection is not available since it requires ground truth data in the analysis set.
{% endhint %}

Multivariate drift detection is the first step in covariate shift detection, focusing on detecting any changes in the data structure over time. The accuracy and reconstruction error plot shows alerts in the last three months, which tells us that covariate shift is possibly responsible for it. But we still don't know what real-world changes are causing this. To figure that out, we need to analyze the drifting features more deeply.

## Why did the performance drop?

Once we’ve identified a performance issue, we need to troubleshoot it. The first step is to look into potential distribution shifts for all the features in the covariate shift panel.

We have six methods to determine the amount of shift in each feature. To begin the process, we focus on the four most important features: **hotel**, **lead\_time**, **parking\_spaces**, and **country**. These features were determined using the feature importance method after the model was trained. To streamline the analysis, the methods used are **l-infinity** for categorical variables and the **Wasserstein** method for continuous features.

<figure><img src="https://content.gitbook.com/content/2wXpsFdZLc0Ed8e18KiO/blobs/T7Ykfe4Sfaiya6fOkTDm/quickstart_country.png" alt=""><figcaption><p>
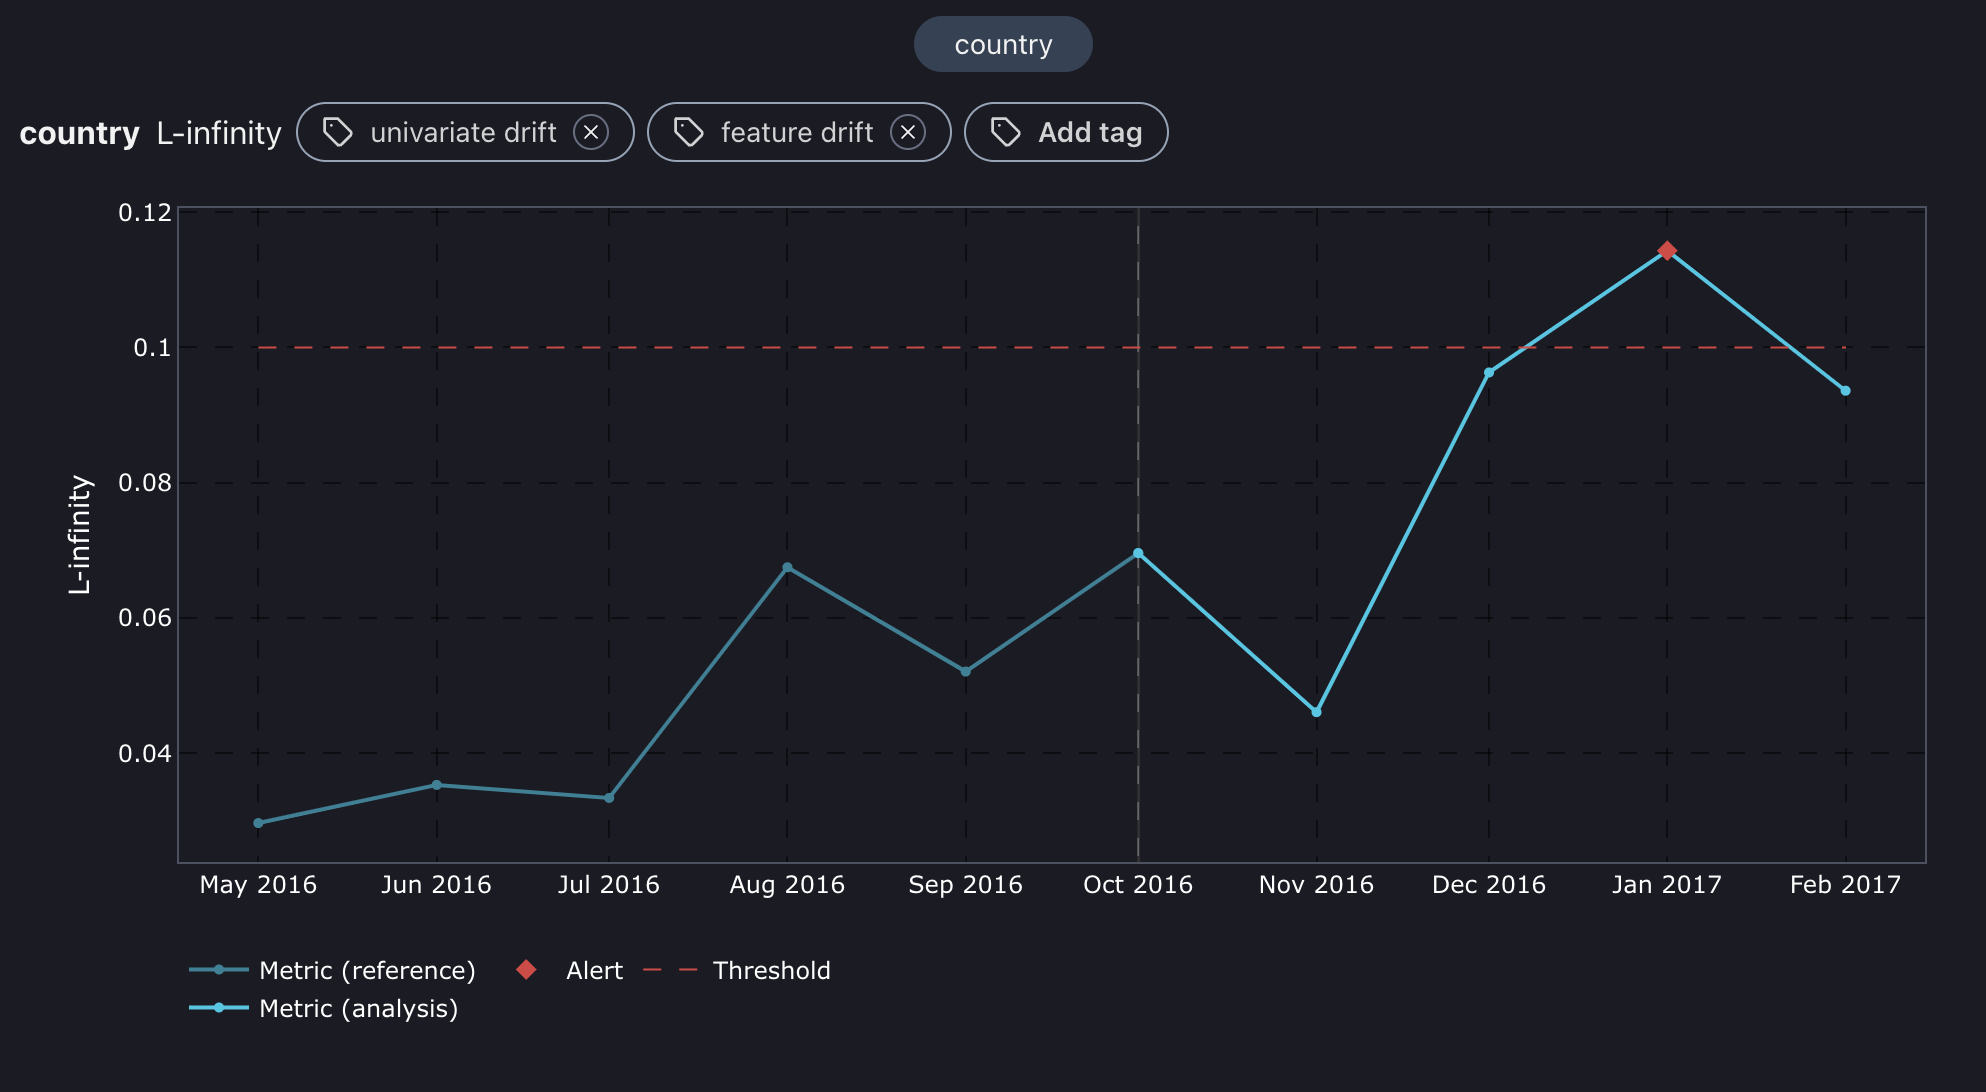
L-infinity plot for country feature.</p></figcaption></figure>

<figure><img src="https://content.gitbook.com/content/2wXpsFdZLc0Ed8e18KiO/blobs/KswyHVroa29SwtY0Yy1M/quickstart_hotel.png" alt=""><figcaption><p>
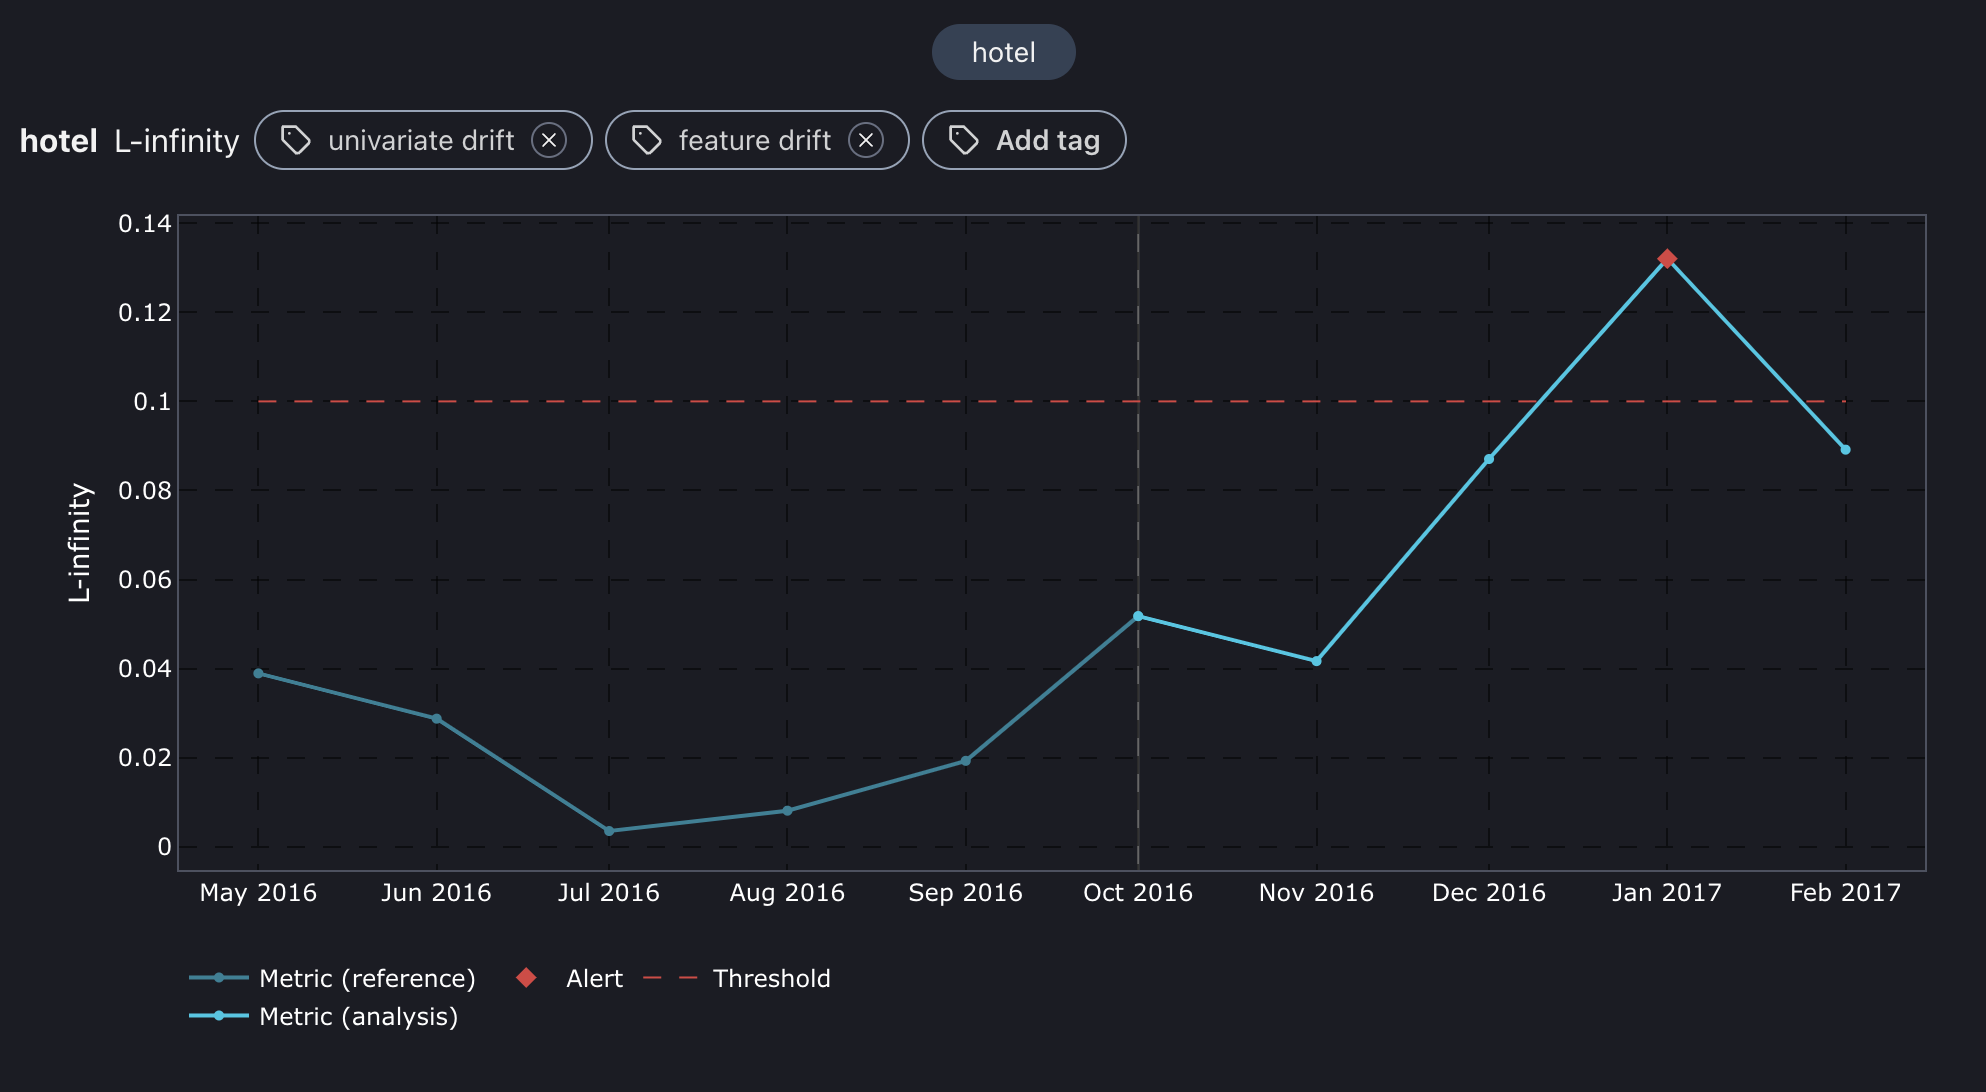
L-infinity plot for hotel feature.</p></figcaption></figure>

<figure><img src="https://content.gitbook.com/content/2wXpsFdZLc0Ed8e18KiO/blobs/uEqfrlg1OVD95X68lEDY/quickstart_lead_time.png" alt=""><figcaption><p>
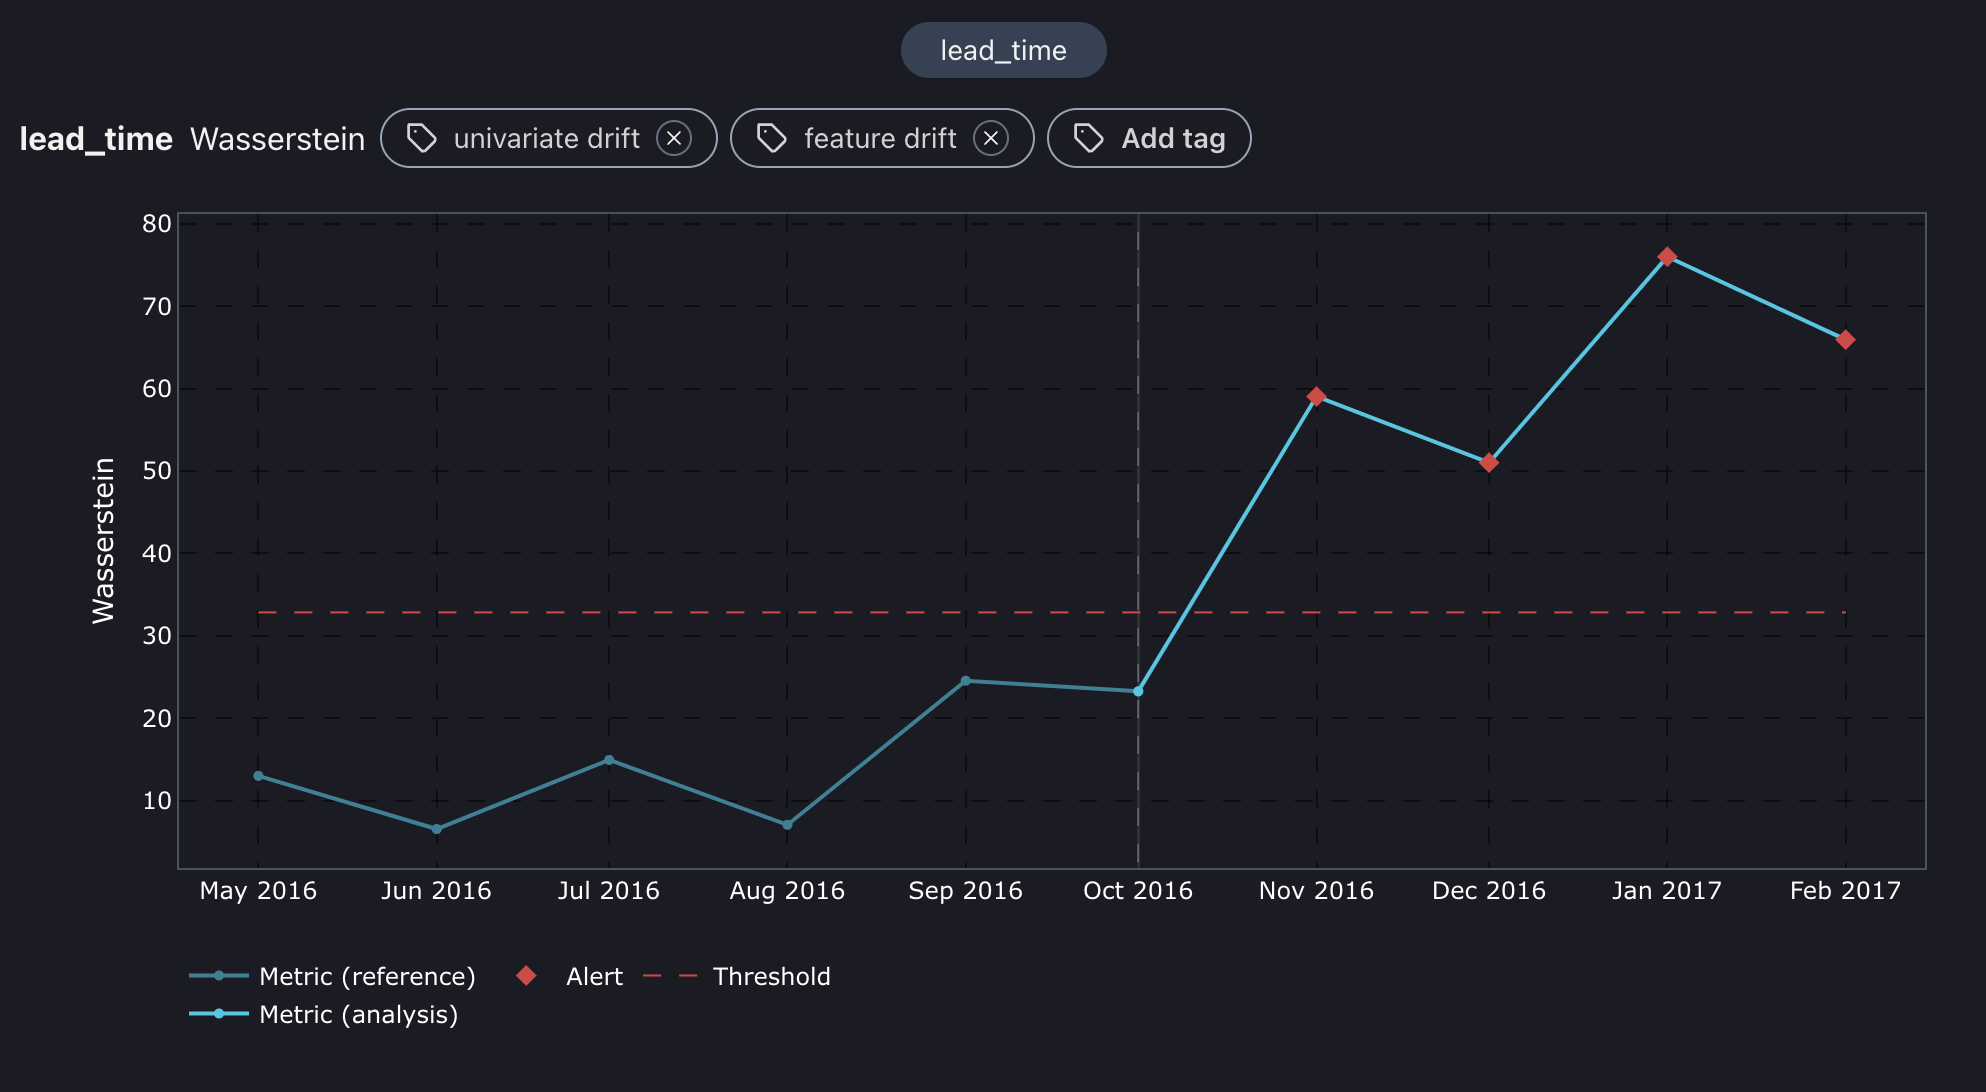
Wasserstein distance plot for lead_time feature.</p></figcaption></figure>

<figure><img src="https://content.gitbook.com/content/2wXpsFdZLc0Ed8e18KiO/blobs/46ghMWHYgPZJGk9O9JTJ/quickstart_parking_spaces.png" alt=""><figcaption><p>
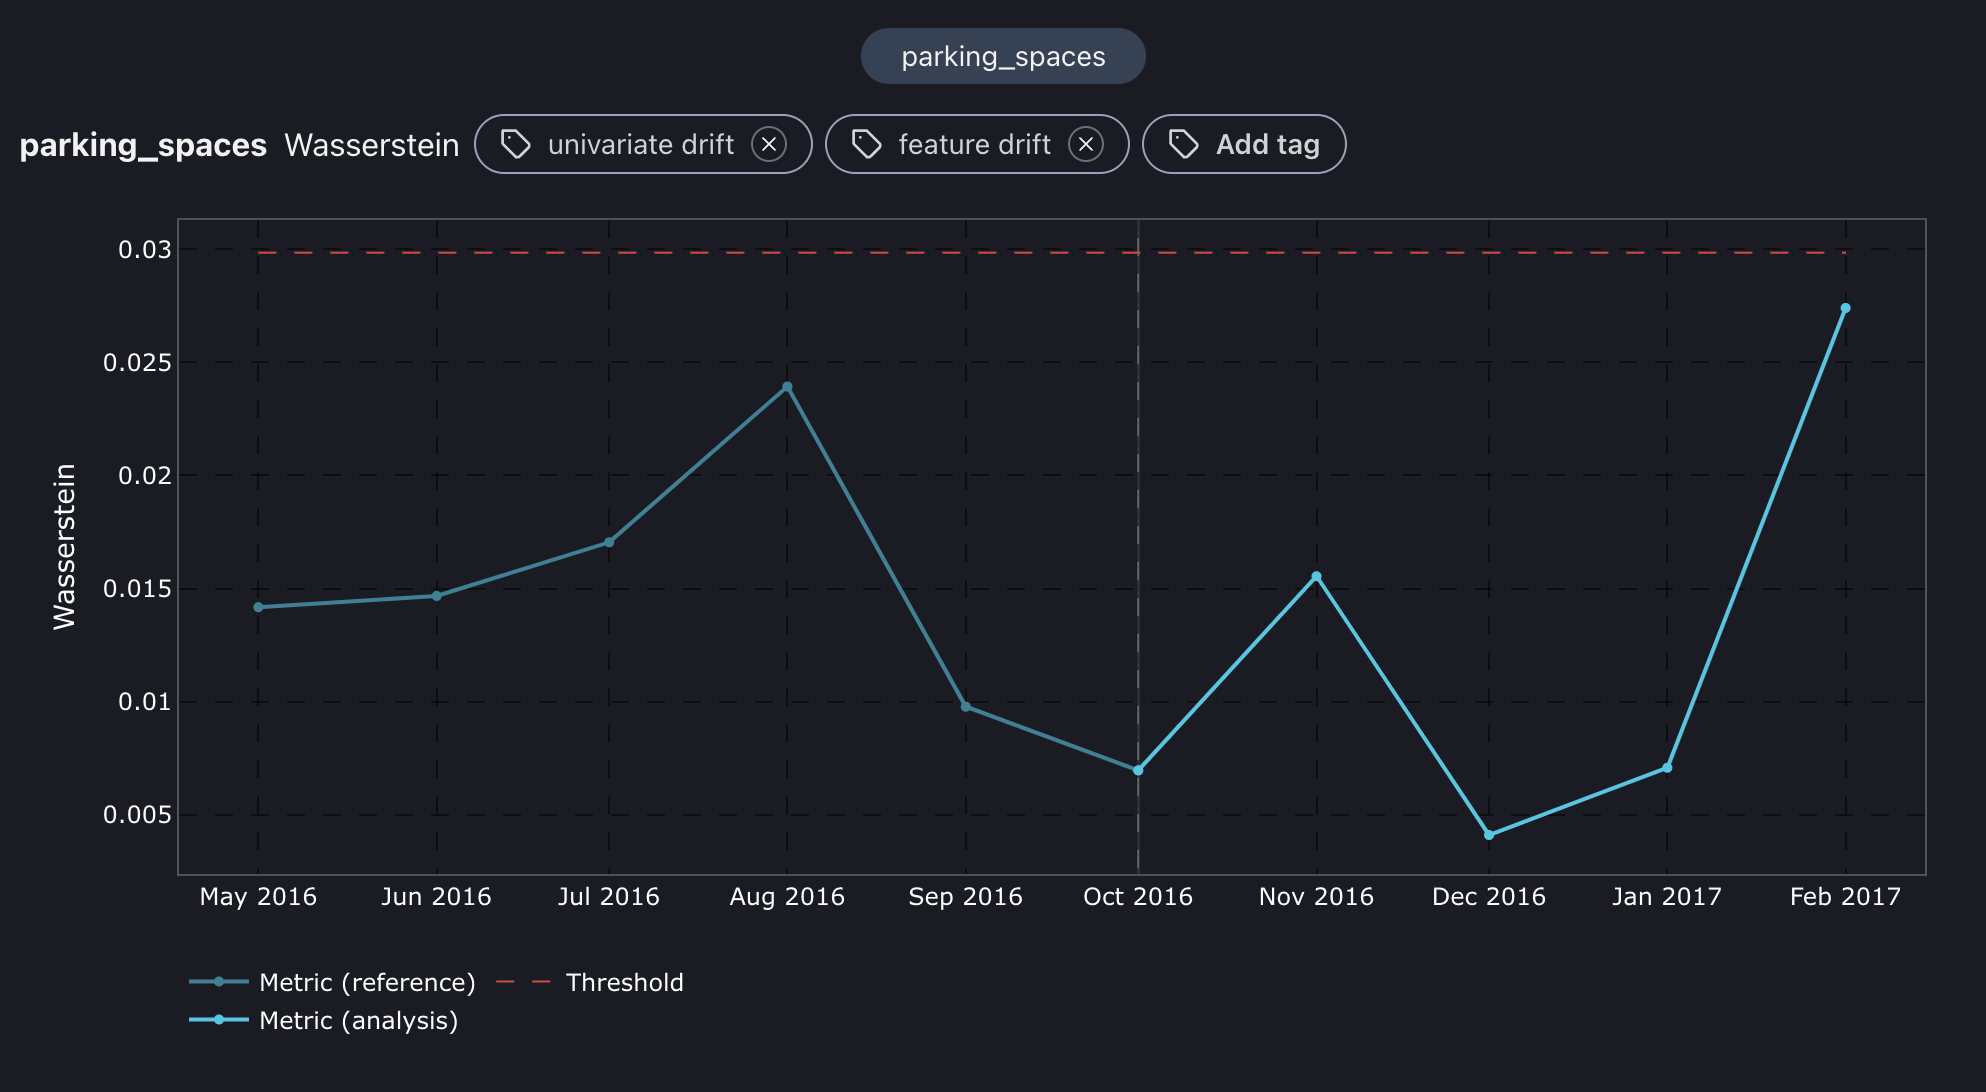
Wasserstein distance plot for parking_spaces feature.</p></figcaption></figure>

For the features **country** and **hotel**, we noticed a shift in February that lines up with a drop in performance. Also, **lead\_time** began to drift from December to March, which is exactly when we started seeing a gradual decline in accuracy. So, it looks like the root cause is linked to the drift in these three features. Now, let's reason more broadly about these shifts and relate them to the customer's behavior around that time.

## Shift explanations

The root cause is associated with the drift in three key features: **lead\_time**, **hotel**, and **country**. During November-March, it's common for the temperatures in northern European countries like Germany, Sweden, and the Netherlands to drop below 0 degrees. Additionally, many children had their winter break at that time, allowing them to travel with their parents. It's possible that tourists from northern Europe chose to visit Portugal during this period to escape the cold, which explains the shift in the country's feature distribution.

Furthermore, Portugal's sunny weather and temperatures around 20 degrees are mainly found in Algarve, the southern part of the country, as opposed to Lisbon, where temperatures are around 15 degrees. This accounts for the shift in the hotel distribution feature, as more people are booking hotels in the Algarve. Lastly, many of these winter getaways by foreigners are typically planned well in advance to secure travel tickets, make train reservations, request time off from work, and make other preparations. This advanced planning explains the significant shift in the lead time feature.

These changes ultimately resulted in a decrease in the performance of the model during the December to March period.

## Comparing estimated and realized performance

We used performance estimation before since our analysis set didn't have targets. Now, we can add to validate the estimations and see if the concept drift has also affected the performance.

{% tabs %}
{% tab title="NannyML Cloud UI" %}

1. Go to [Model settings](https://docs.nannyml.com/cloud/product-tour/model-side-panel/model-settings).
2. Click on the **Add new rows** button.

<figure><img src="https://content.gitbook.com/content/2wXpsFdZLc0Ed8e18KiO/blobs/OYvzKkQb4w6QNG1aJtPV/quickstart_add_targets.png" alt="" width="375"><figcaption><p>
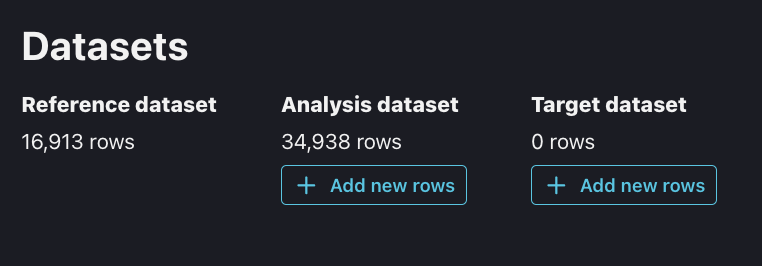
Datasets section in Model settings.</p></figcaption></figure>

3. Upload the target dataset via the following link: - `https://raw.githubusercontent.com/NannyML/sample_datasets/main/hotel_booking_dataset/hotel_booking_gt_march.csv`
4. Run the analysis.
   {% endtab %}

{% tab title="NannyML Cloud SDK" %}
We first need to load our target data before we upload it to the NannyML Cloud. Once we've done that, just run NannyML Cloud again to view the realized performance and concept shift results.

```python
target_data = pd.read_csv("https://raw.githubusercontent.com/NannyML/sample_datasets/main/hotel_booking_dataset/hotel_booking_gt_march.csv")
model_id = model["id"]
nml_sdk.Model.add_analysis_target_data(model_id, target_data)
nml_sdk.Run.trigger(model_id)
```

{% endtab %}
{% endtabs %}

<figure><img src="https://content.gitbook.com/content/2wXpsFdZLc0Ed8e18KiO/blobs/2lP9MC3DBXhiMSptkY1i/quickstart_perf_dashboard.png" alt=""><figcaption><p>
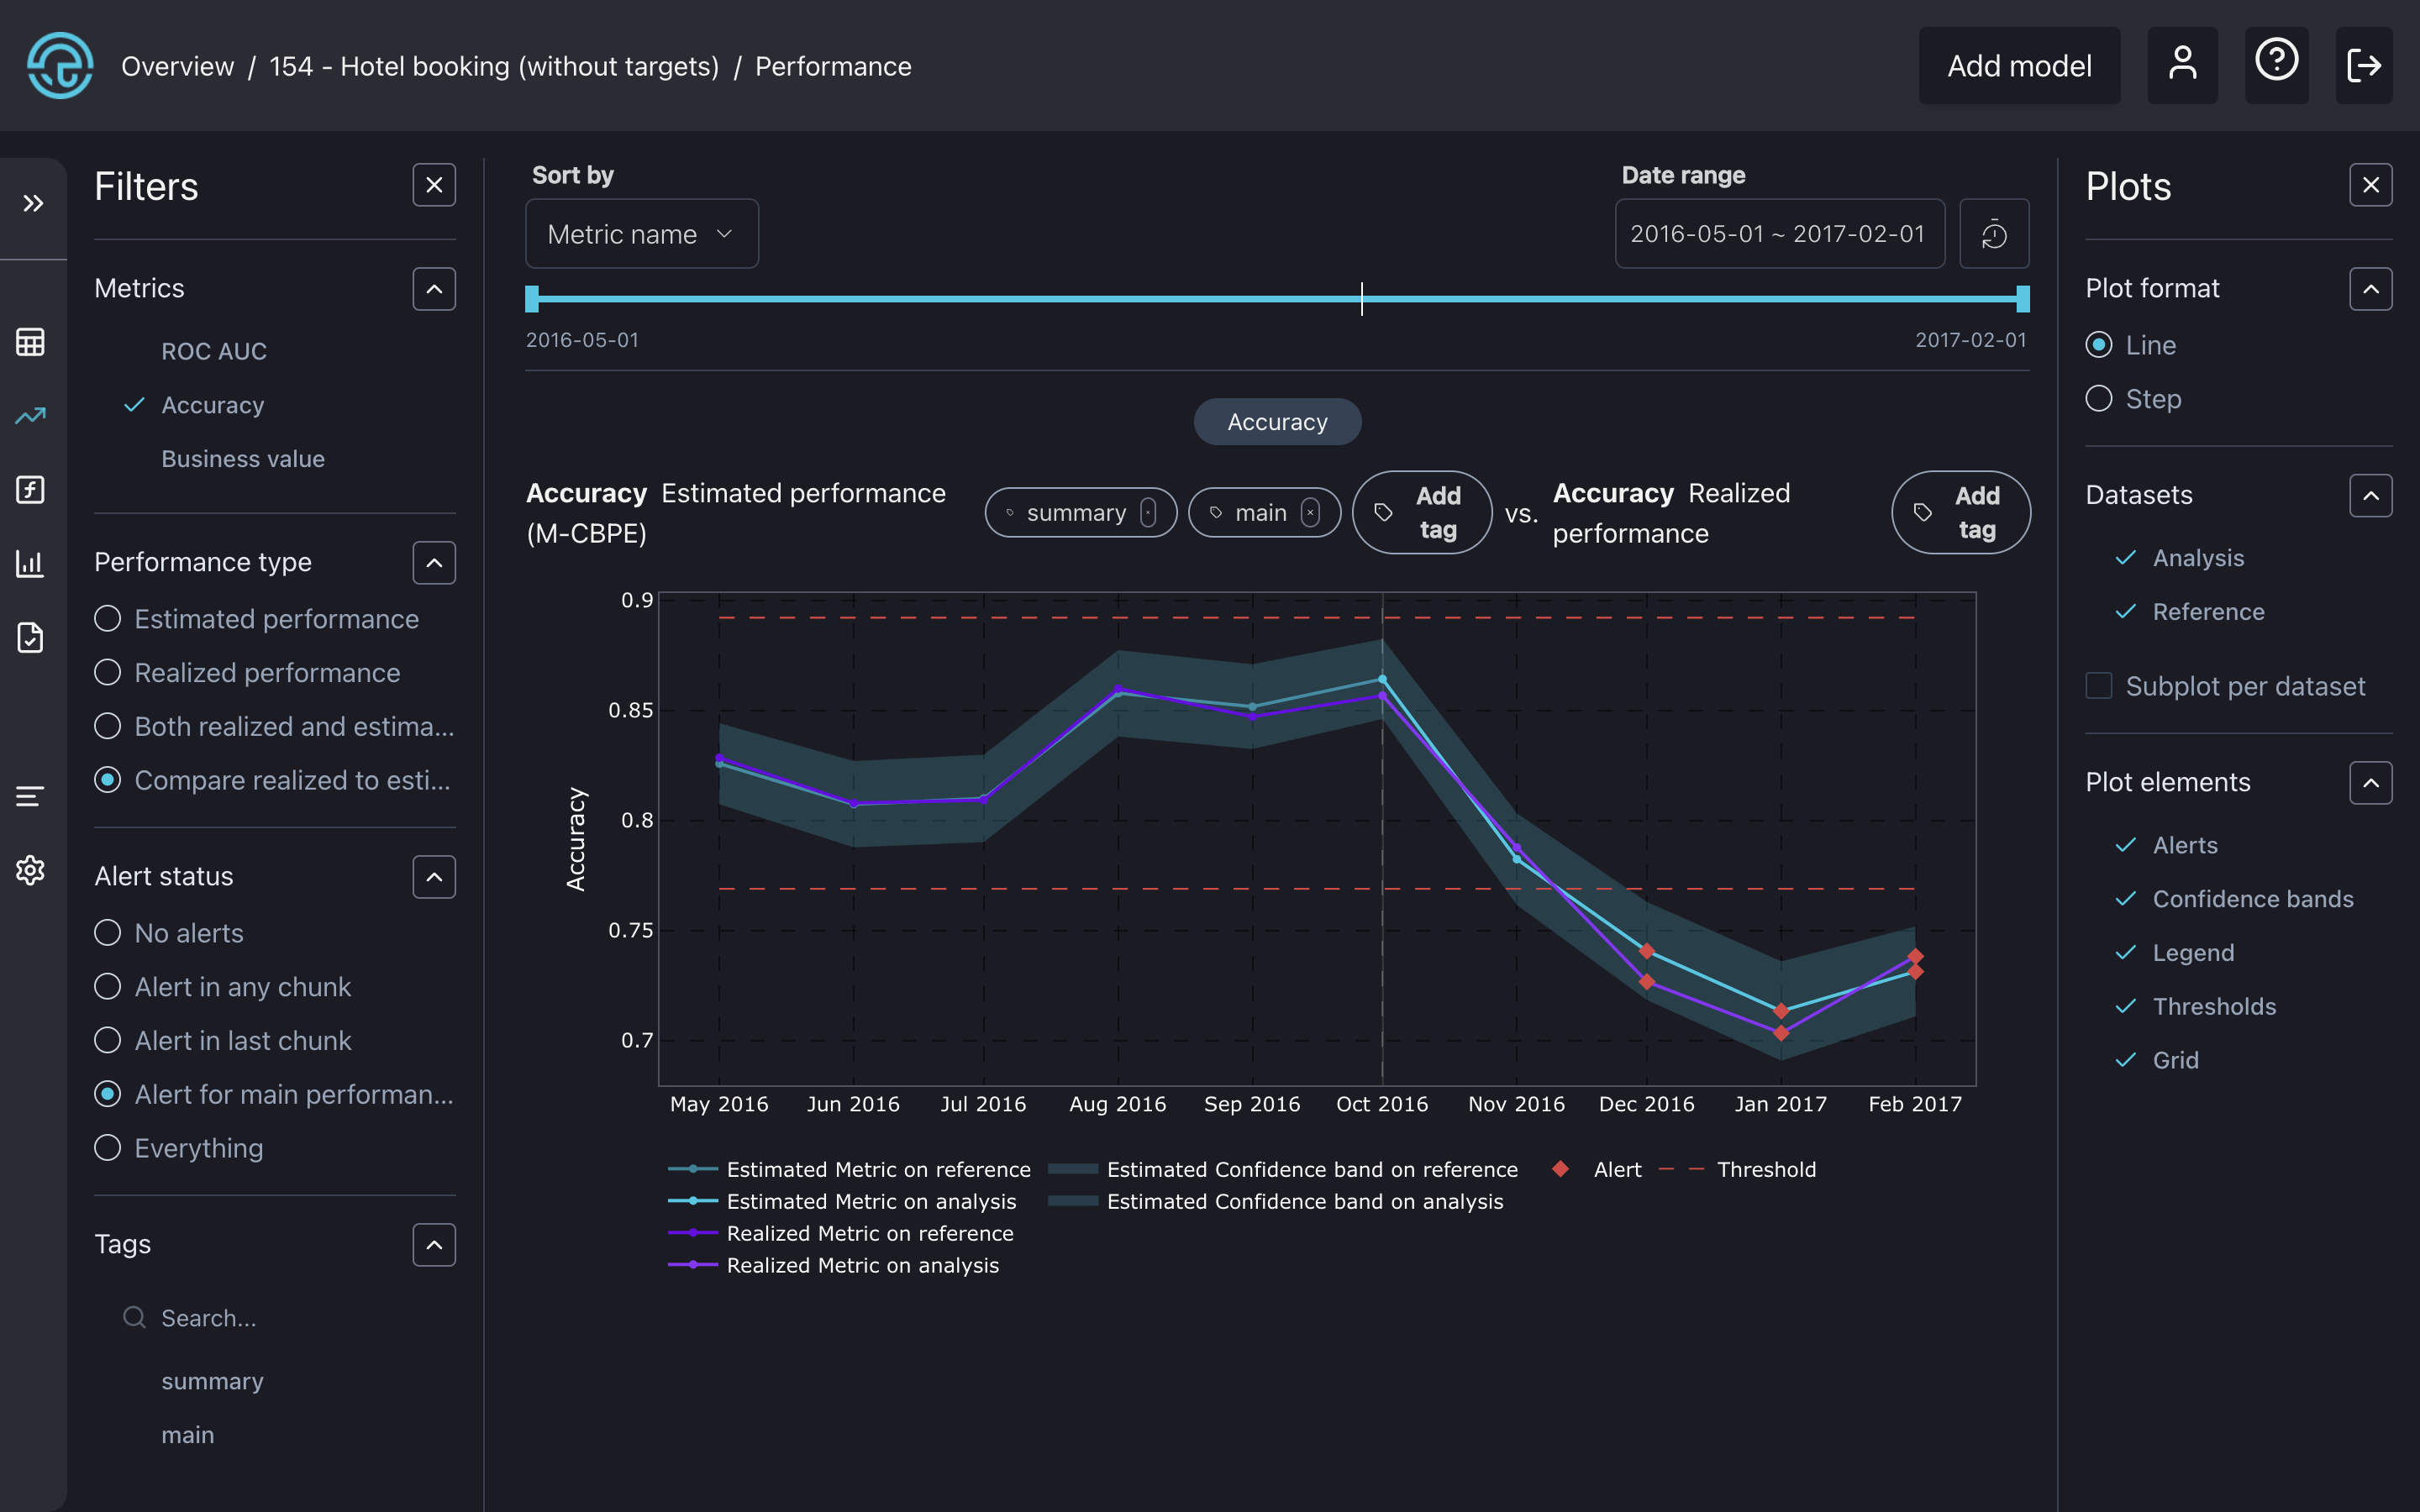
The performance dashboard with a comparison plot between realized and estimated performance.</p></figcaption></figure>

We can see that the realized performance also dropped in December, January, and February, confirming that the estimations were really accurate. Let's check if the concept drift is present in our data.

## Concept drift detection

<figure><img src="https://content.gitbook.com/content/2wXpsFdZLc0Ed8e18KiO/blobs/G1LWQhDq5X1t7X1oYkrQ/quickstart_concept_shift_dashboard.png" alt=""><figcaption><p>
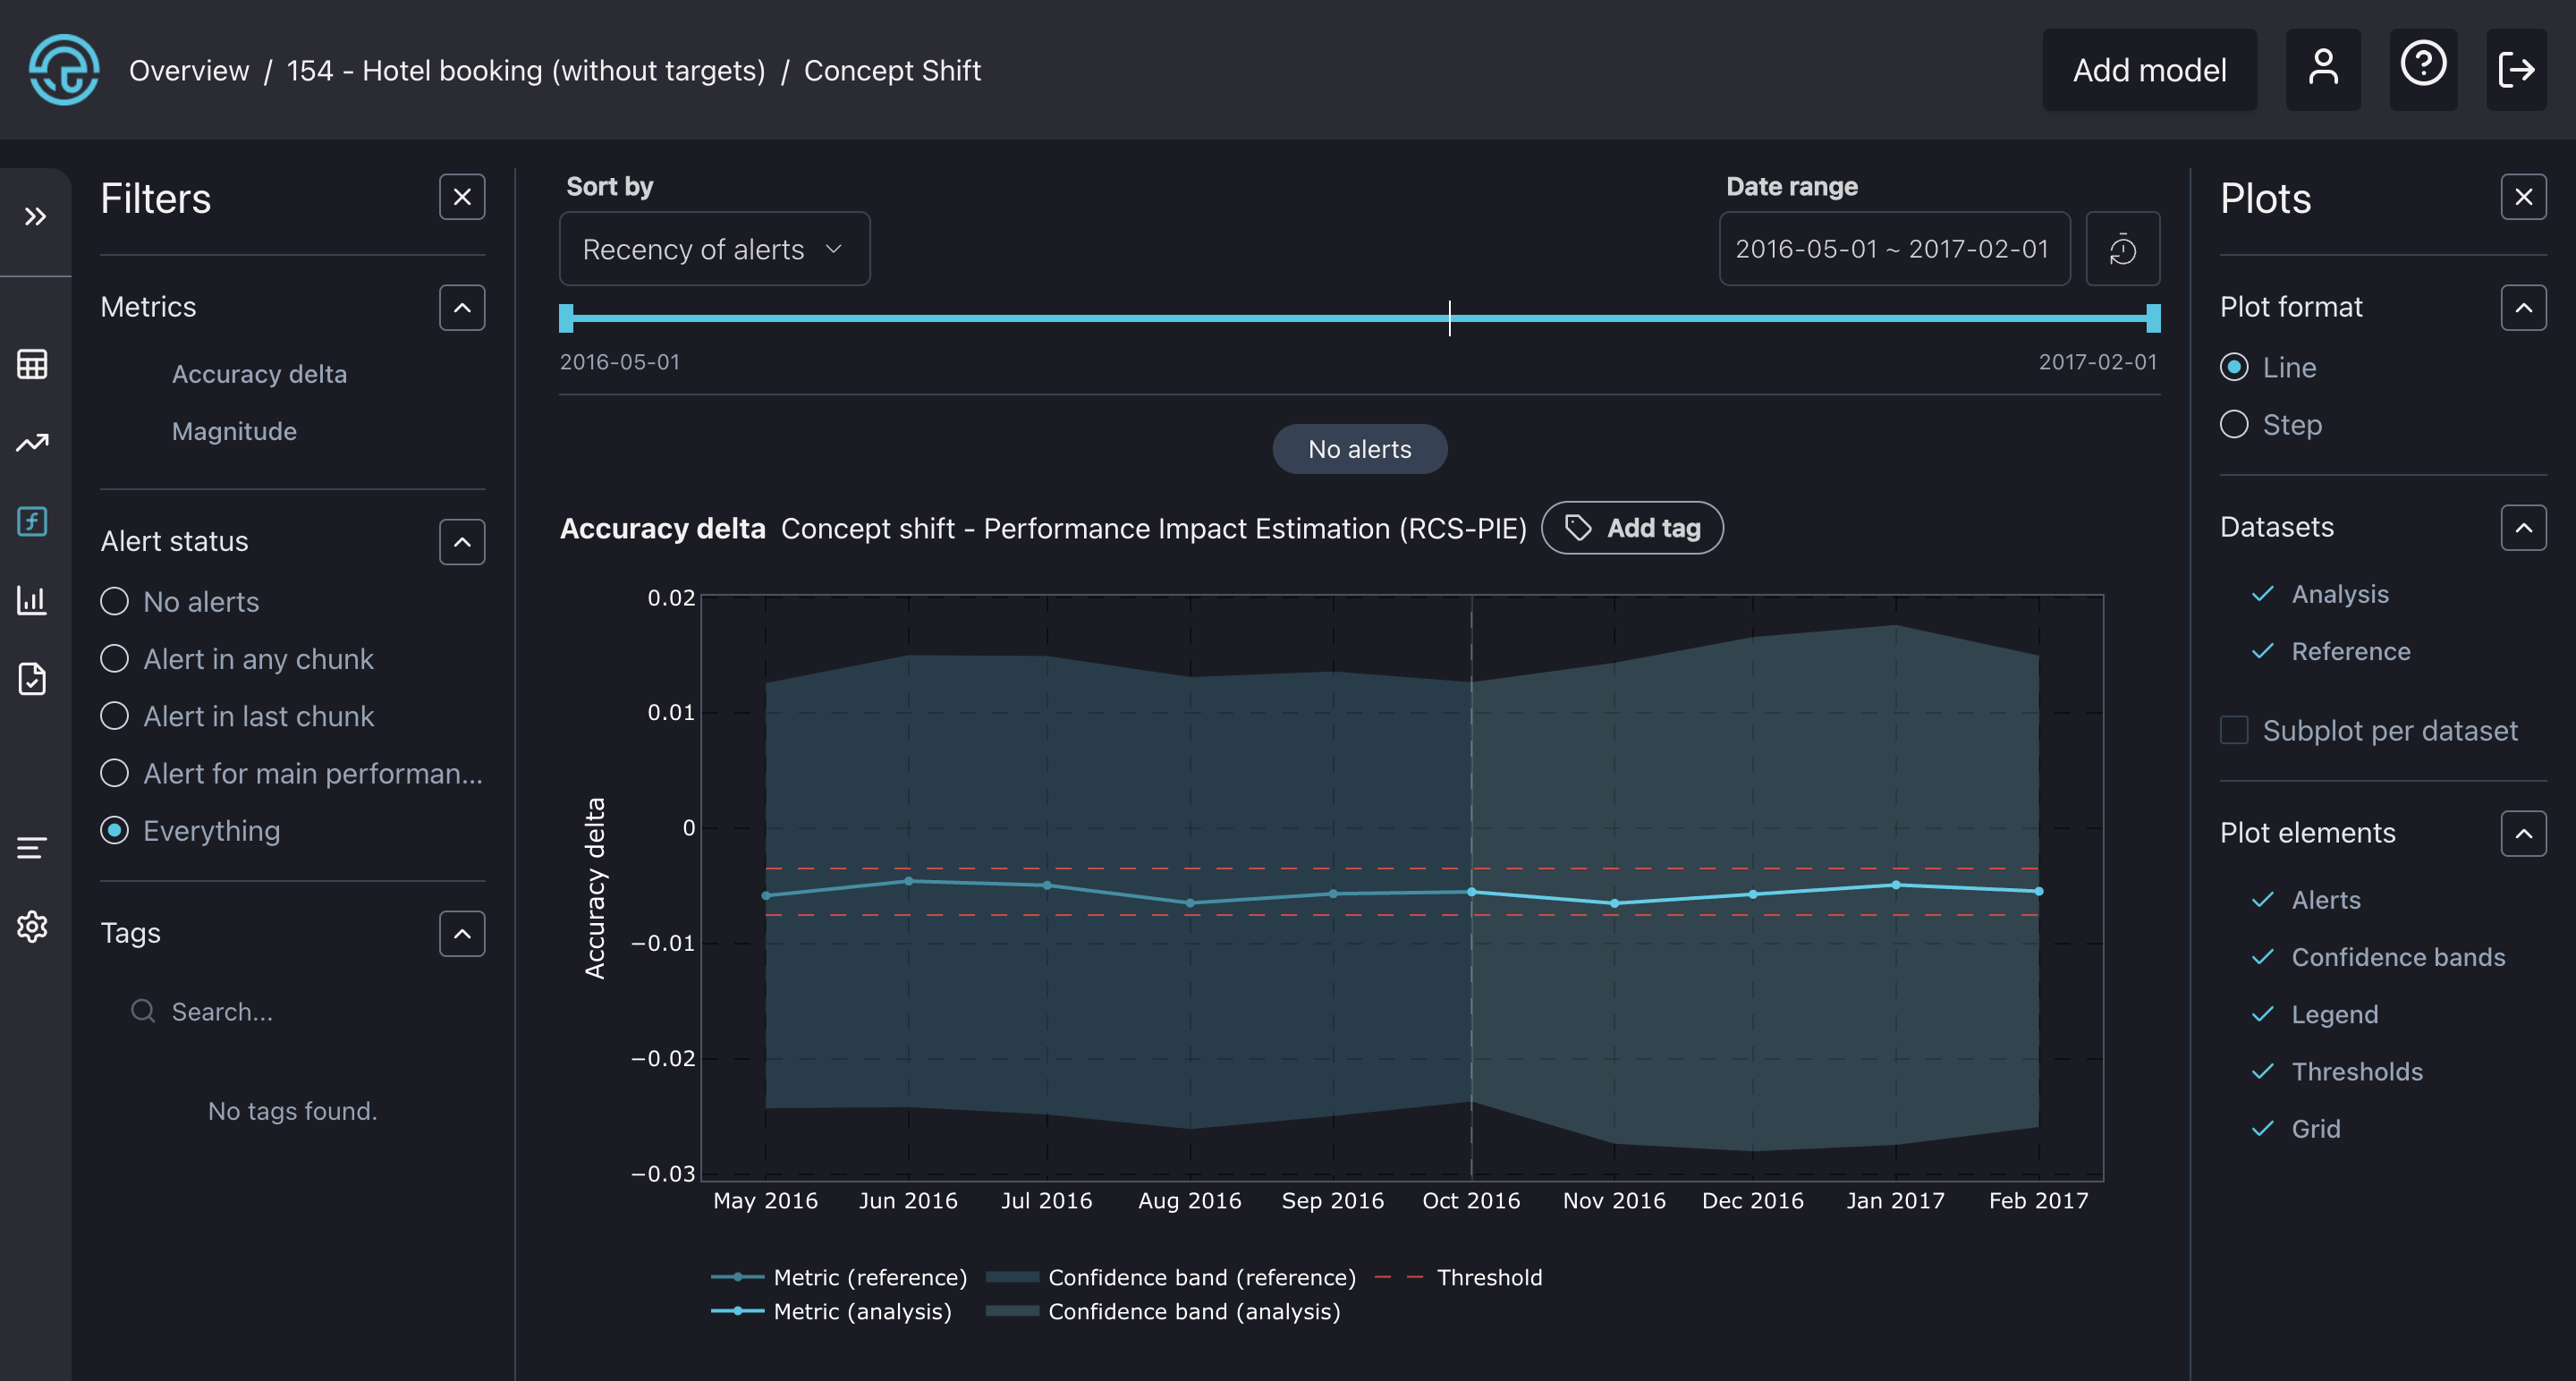
The concept drift dashboard with a plot showing the impact of concept drift on accuracy.</p></figcaption></figure>

The graph illustrates the impact of concept drift on performance, with the x-axis representing the change in accuracy due to concept drift. As we can see, it's less than -0.01 and remains within the specified thresholds, not triggering any alerts. This suggests that concept drift did not contribute to a drop in accuracy during that period, only previously analyzed covariate shift!

## What's next?

<table data-view="cards"><thead><tr><th></th><th></th></tr></thead><tbody><tr><td>🧭 <a href="../product-tour"><strong>Product tour</strong></a></td><td>Discover what else you can do with NannyML Cloud.</td></tr><tr><td>🧑‍💻 <a href="tutorials"><strong>Tutorials</strong></a></td><td>Explore how to use NannyML Cloud with text and images</td></tr><tr><td>👷‍♂️ <a href="how-it-works"><strong>Miscellaneous</strong></a></td><td>Learn how the NannyML Cloud works under the hood</td></tr></tbody></table>
