HDI+ROPE (with minimum precision)
This page explains Bayesian HDI+ROPE decision rule (with minimum precision).
What is ROPE and HDI?
ROPE is an acronym for the Region of Practical Equivalence. It is the range around the null value of the parameter of interest that is practically equivalent to it. Why do we need it? Let's take a coin flip as an example: a perfectly fair coin has a probability of landing heads equal to p=0.5. We have a coin and we would like to investigate whether it's fair. We run experiments, and using the Bayesian approach, we get a posterior probability distribution of the parameter in question. Since this probability distribution is continuous, the probability of any discrete parameter value (including p=0.5) is zero. Only ranges have a non-zero probability, so asking a question of whether the probability is equal to 0.5 has no meaning. From a Practical perspective, it will often be enough if p lies somewhere between 0.48-0.52. That is ROPE.
Having defined the ROPE for our case, we ran experiments and checked where most of the probability density function lies with respect to that ROPE. In this framework, the most is measured by the highest density interval (HDI). HDI is a range (or set of ranges, for multimodal distributions) so that any value of the parameter inside that range has a higher probability density than any value outside of it.
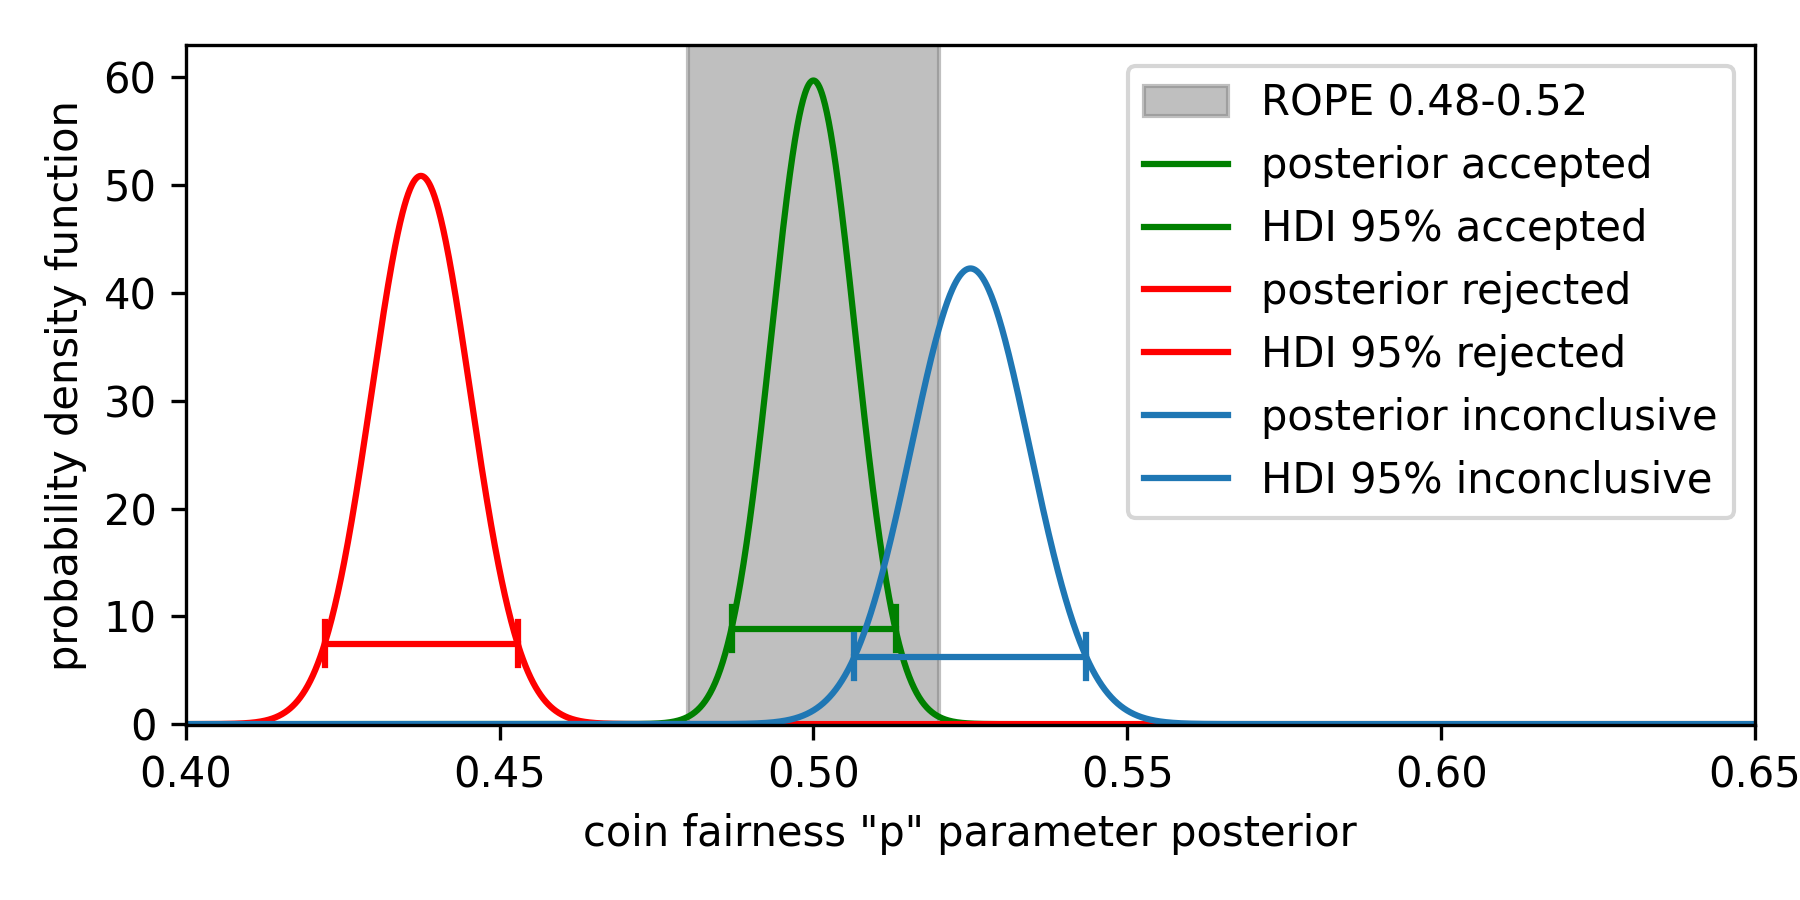
HDIs contain the required probability mass, usually 95 %. In this framework, if 95% HDI lies fully within the ROPE, we can accept the null hypothesis and claim that the coin is fair (given the prior data and the definition of fair coin we used). If it is outside - we can reject it. Suppose only part of HDI is inside the ROPE. In that case, we either say that the experiment is inconclusive (given the data observed), or we keep the experiment running, gather more data, and wait for HDI to fully get inside/outside ROPE. In some specific cases, though, we will never get a conclusive answer, regardless of the length of the experiment (that is, the amount of data). Figure 1 illustrates the described cases.

Estimation precision - HDI Width
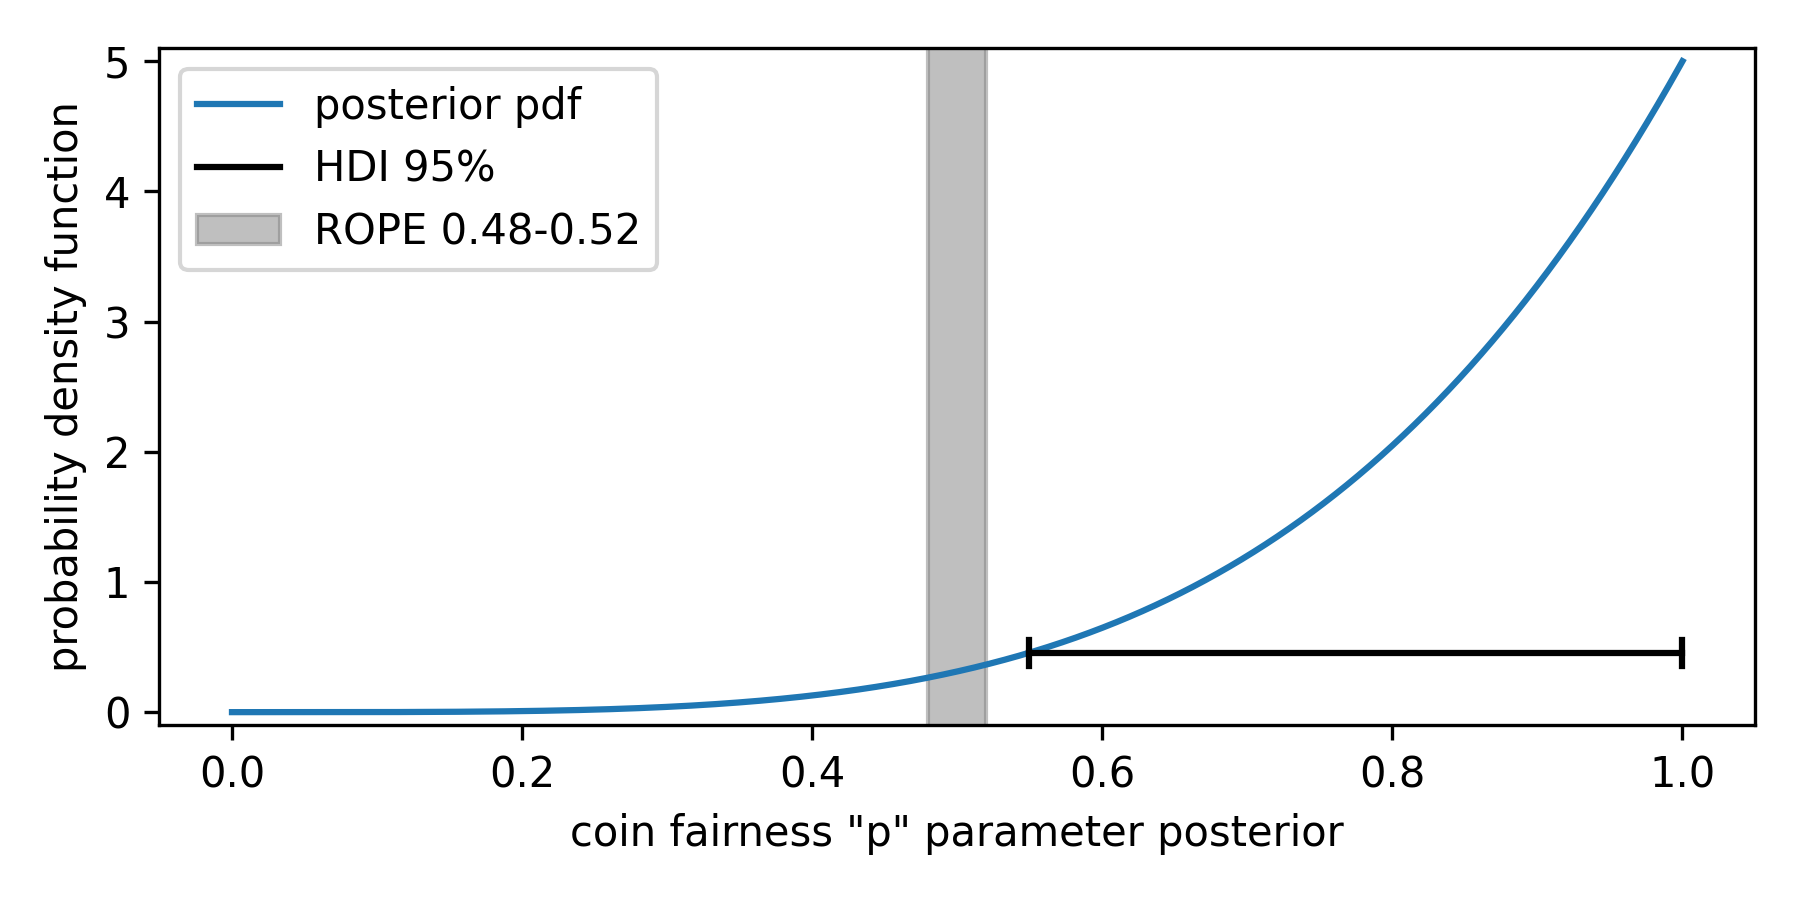
HDI width can be considered a measure of the precision of the parameter estimation. The narrower the HDI, the more precise the estimate is. Typically, precision increases (HDI width decreases) with the amount of data collected. Usually, we want to meet some predefined HDI width level before we start evaluating where the HDI is with respect to ROPE. This is to avoid falsely rejecting or accepting the null hypothesis due to a random series of extreme events. Getting back to the coin case - it may happen that a perfectly fair coin lands heads for the first several flips. This may give an HDI of 95% that is fully outside of ROPE, and if we stop the experiment at this moment, we will falsely reject the null hypothesis (Figure 2. shows the posterior obtained for getting four heads in a row). The precision-based criterium is considered the most effective at limiting false decisions, but it usually requires larger samples of data compared to other criteria.
