NannyML Cloud
HomeBlogNannyML OSS Docs
v0.24.1
v0.24.1
  • ☂️Introduction
  • Model Monitoring
    • Quickstart
    • Data Preparation
      • How to get data ready for NannyML
    • Tutorials
      • Monitoring a tabular data model
      • Monitoring with segmentation
      • Monitoring a text classification model
      • Monitoring a computer vision model
    • How it works
      • Probabilistic Adaptive Performance Estimation (PAPE)
      • Reverse Concept Drift (RCD)
    • Custom Metrics
      • Creating Custom Metrics
        • Writing Functions for Binary Classification
        • Writing Functions for Multiclass Classification
        • Writing Functions for Regression
        • Handling Missing Values
        • Advanced Tutorial: Creating a MTBF Custom Metric
      • Adding a Custom Metric through NannyML SDK
    • Reporting
      • Creating a new report
      • Report structure
      • Exporting a report
      • Managing reports
      • Report template
      • Add to report feature
  • Product tour
    • Navigation
    • Adding a model
    • Model overview
    • Deleting a model
    • Model side panel
      • Summary
      • Performance
      • Concept drift
      • Covariate shift
      • Data quality
      • Logs
      • Model settings
        • General
        • Data
        • Performance settings
        • Concept Drift settings
        • Covariate Shift settings
        • Descriptive Statistics settings
        • Data Quality settings
    • Account settings
  • Deployment
    • Azure
      • Azure Managed Application
        • Finding the URL to access managed NannyML Cloud
        • Enabling access to storage
      • Azure Software-as-a-Service (SaaS)
    • AWS
      • AMI with CFT
        • Architecture
      • EKS
        • Quick start cluster setup
      • S3 Access
    • Application setup
      • Authentication
      • Notifications
      • Webhooks
      • Permissions
  • NannyML Cloud SDK
    • Getting Started
    • Example
      • Authentication & loading data
      • Setting up the model schema
      • Creating the monitoring model
      • Customizing the monitoring model settings
      • Setting up continuous monitoring
      • Add delayed ground truth (optional)
    • API Reference
  • Probabilistic Model Evaluation
    • Introduction
    • Tutorials
      • Evaluating a binary classification model
      • Data Preparation
    • How it works
      • HDI+ROPE (with minimum precision)
      • Getting Probability Distribution of a Performance Metric with targets
      • Getting Probability Distribution of Performance Metric without targets
      • Getting Probability Distribution of Performance Metric when some observations have labels
      • Defaults for ROPE and estimation precision
  • Experiments Module
    • Introduction
    • Tutorials
      • Running an A/B test
      • Data Preparation
    • How it works
      • Getting probability distribution of the difference of binary downstream metrics
  • miscellaneous
    • Engineering
    • Usage logging in NannyNL
    • Versions
      • Version 0.24.1
      • Version 0.24.0
      • Version 0.23.0
      • Version 0.22.0
      • Version 0.21.0
Powered by GitBook
On this page
  • 1. Filters
  • 2. Visualizations
  • 3. Plot config
  1. Product tour
  2. Model side panel

Concept drift

PreviousPerformanceNextCovariate shift

The Concept drift dashboard enables you to analyze the impact and magnitude of concept drift. To calculate these results, NannyML Cloud requires the analysis set to include a ground truth column.

Note: Concept drift detection is currently supported only for binary classification use cases. For custom support in regression use cases, please .

If you prefer a video walkthrough, here is our guide explaining how to use the concept drift page:

Here, you can find detailed descriptions of various elements on the concept drift page:
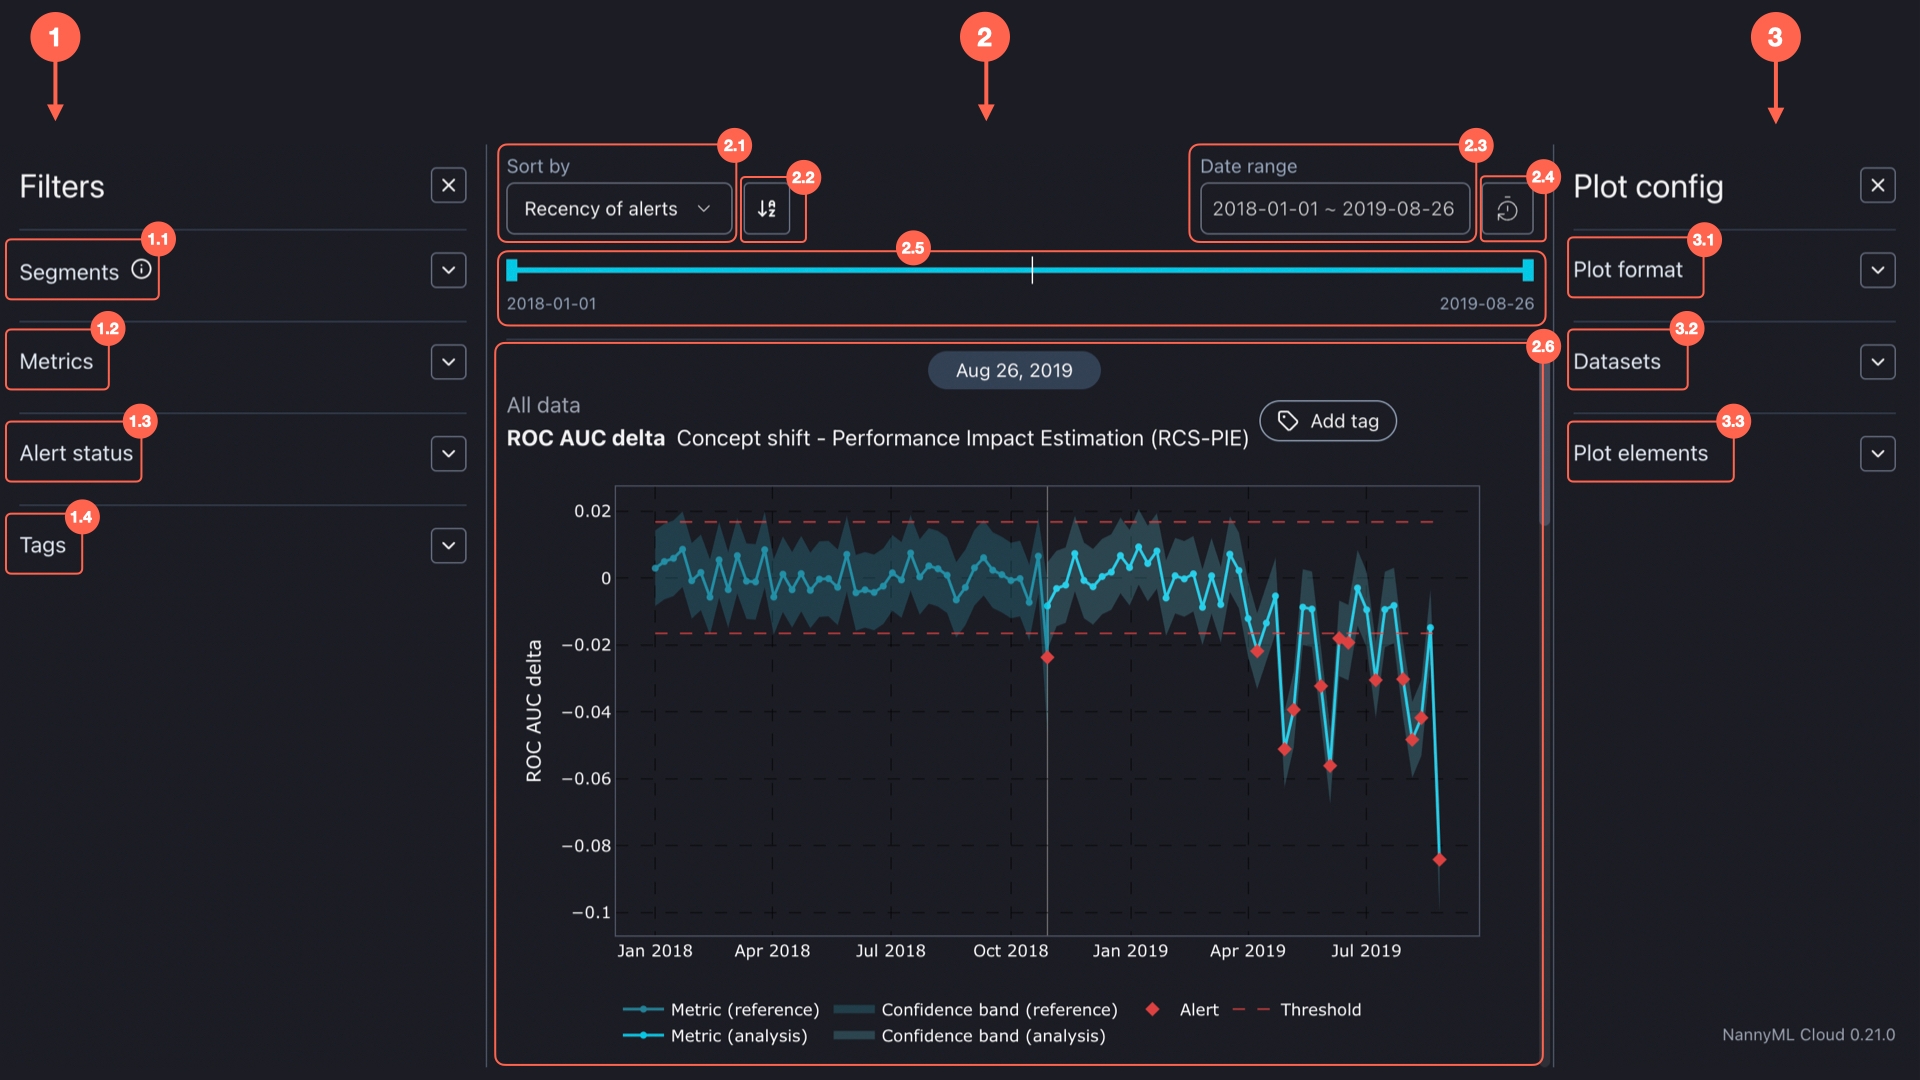
The Concept drift dashboard consists of three main components:

1. Filters

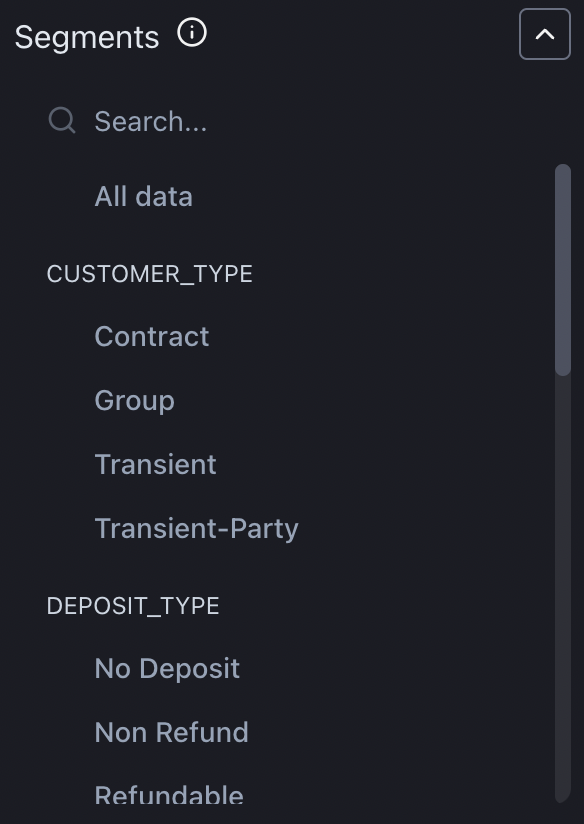
Segmentation allows you to split your data into groups and analyze them separately.

For a given model, each of the columns that are selected for segmentation during configuration or in the model settings appears under the segmentation filter. Segments are then created for each of the distinct values within that column.

In the filter section, you can select the segments you want to see visualized. You can also select All data to visualize results for the entire dataset.
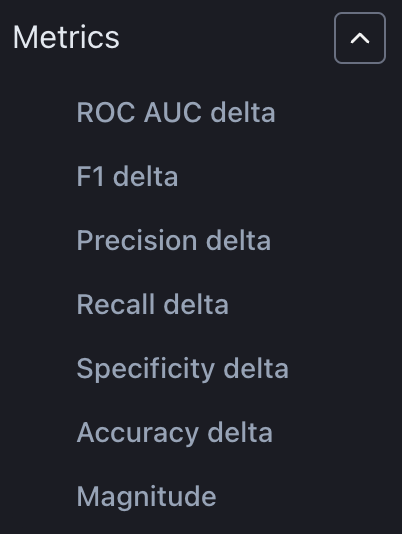
Select which metrics you want to have displayed on the performance impact graph. Additionally, a magnitude metric illustrates the magnitude of concept drift at specific periods.
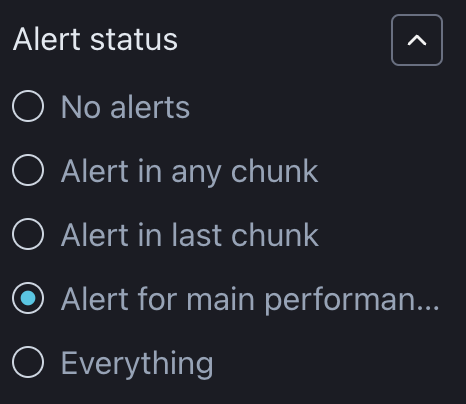
Choose which metrics to display based on whether there are no alerts, alerts in any or only the last chunk, alerts in performance metric with the main tag, or include all charts regardless of when and if any alerts occurred.
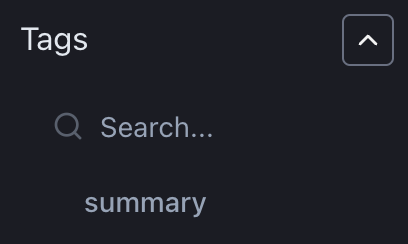
Filter charts by the previously specified tags.
2. Visualizations

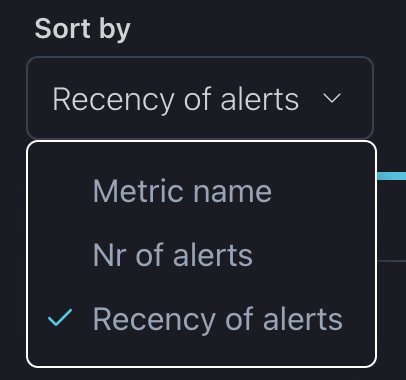
You can change the order of charts based on the metric name, number, or recency of the alerts.
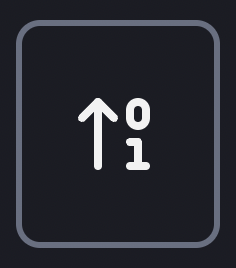
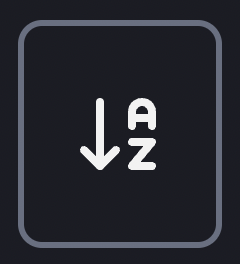
For all sorting methods, the icons shown below toggle between ascending and descending order. The icon displayed depends on the selected sorting method.

  • Metric Name: The icon toggles between alphabetical order and reverse alphabetical order. The default mode is alphabetical order.

  • Nr of Alerts: The icon toggles between ascending and descending order based on the number of alerts. The default mode displays plots with the most alerts first.

  • Recency of Alerts: The icon toggles between showing newer alerts first and older alerts first. The default mode shows the most recent alerts first.
You can select a specific period of interest which applies to all charts.
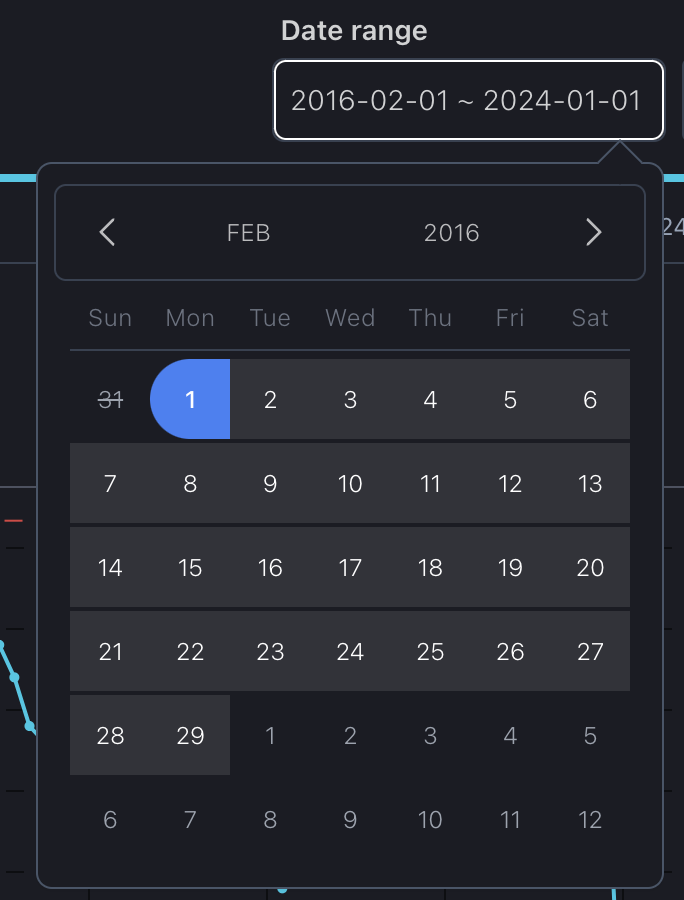
To reset a previously set date period, whether using the date range or slider, simply press the "Reset" button.

Similar to selecting a date range, you can choose a specific period of interest by simply moving the date slider.

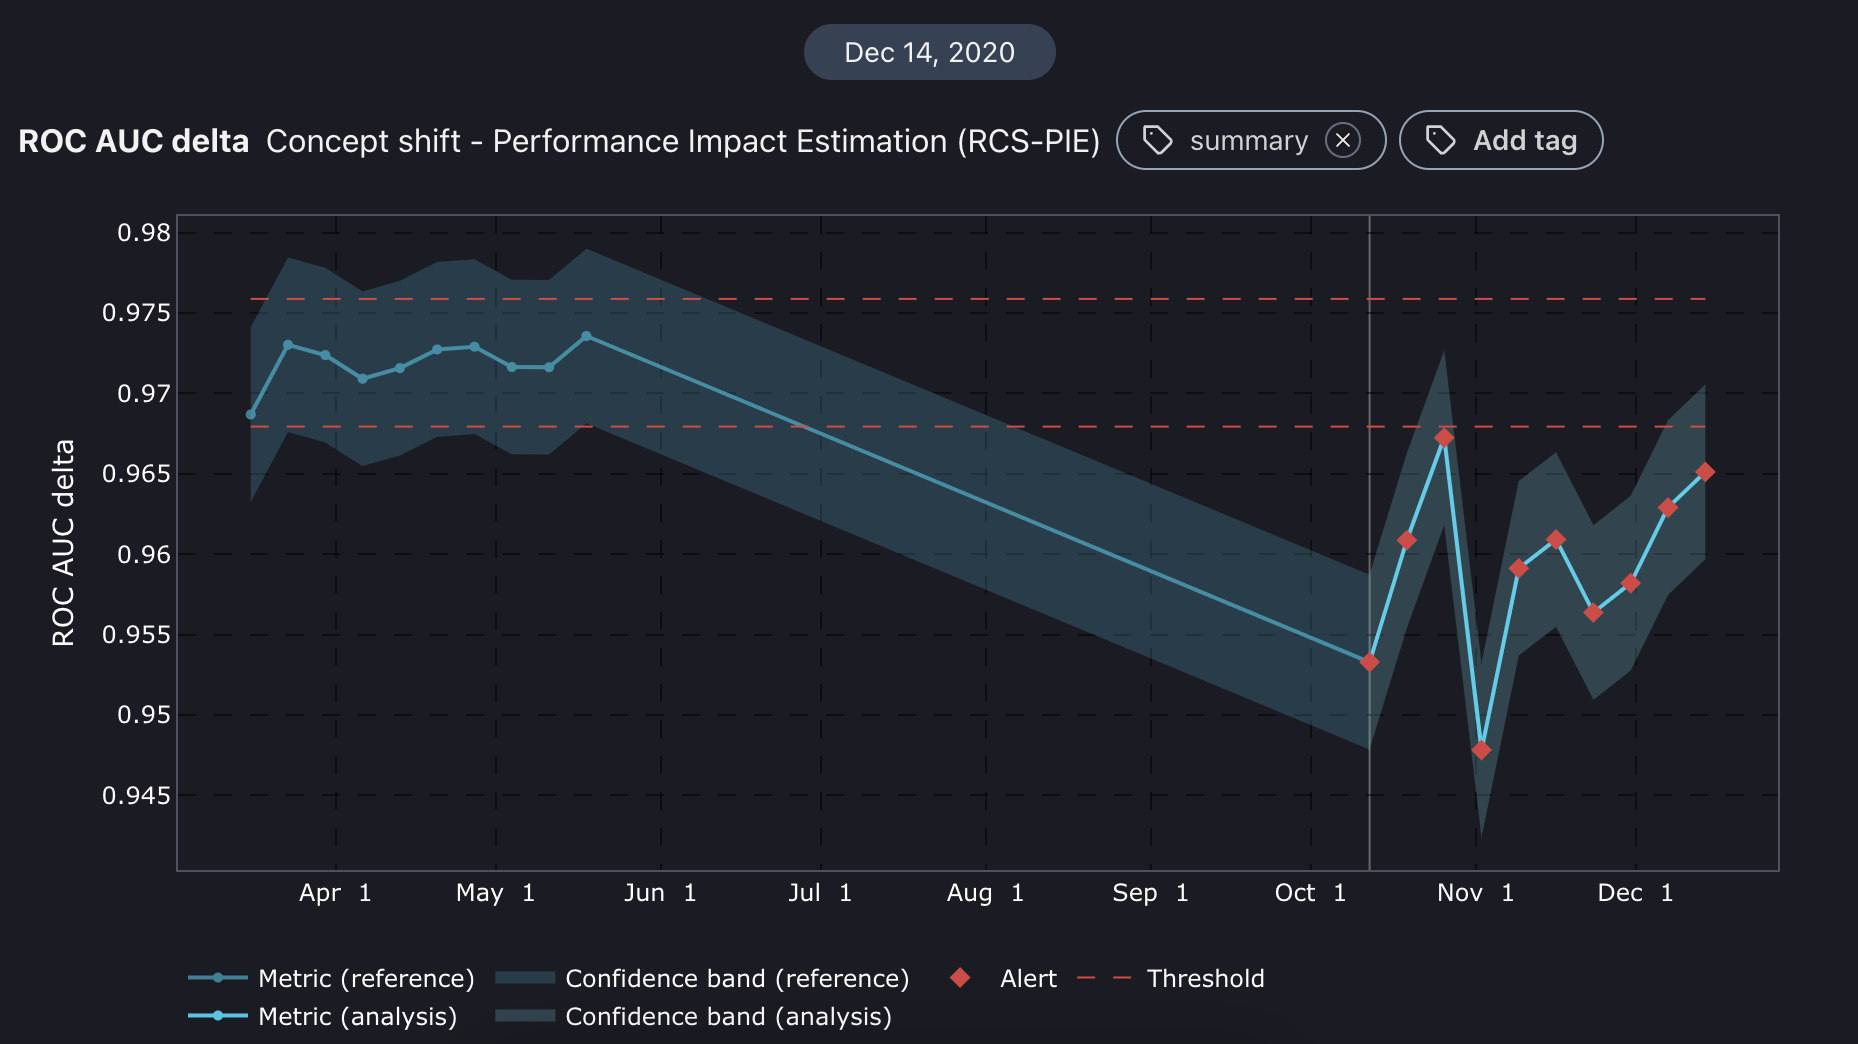
The charts are interactive, allowing you to hover over them for more details. Red dotted lines indicate the thresholds, while the blue line shows the metric during the reference period. The light blue line represents the metric during the analysis period. The lightly shaded area around the performance impact estimation is the metric's confidence band.

You can also zoom in on any part of a chart. Simply press and hold your mouse button, then draw a square over your area of interest. To reset the zoom, just double-click on the chart.
3. Plot config

There are two types of plot formats: line and step. A line plot smoothly connects points with straight lines to show trends, while a step plot uses sharp vertical and horizontal lines to show exact changes between points clearly.

Select datasets to zoom in on reference, analysis, or create a separate subplot for both.

Toggle on or off some components on the charts, like alerts, confidence bands, thresholds, and legends.

contact us on our website
Concept shift dashboard.
Select segments of interest
Concept shift metrics filter.
Alert status filter.
Tags filter.
Sort by window.
Toggle for 'Nr of alerts'
Toggle for other sorting methods
Date range window.
Date range reset.
Date slider.
Concept shift chart.
Plot format.
Datasets plots.
Plots elements.