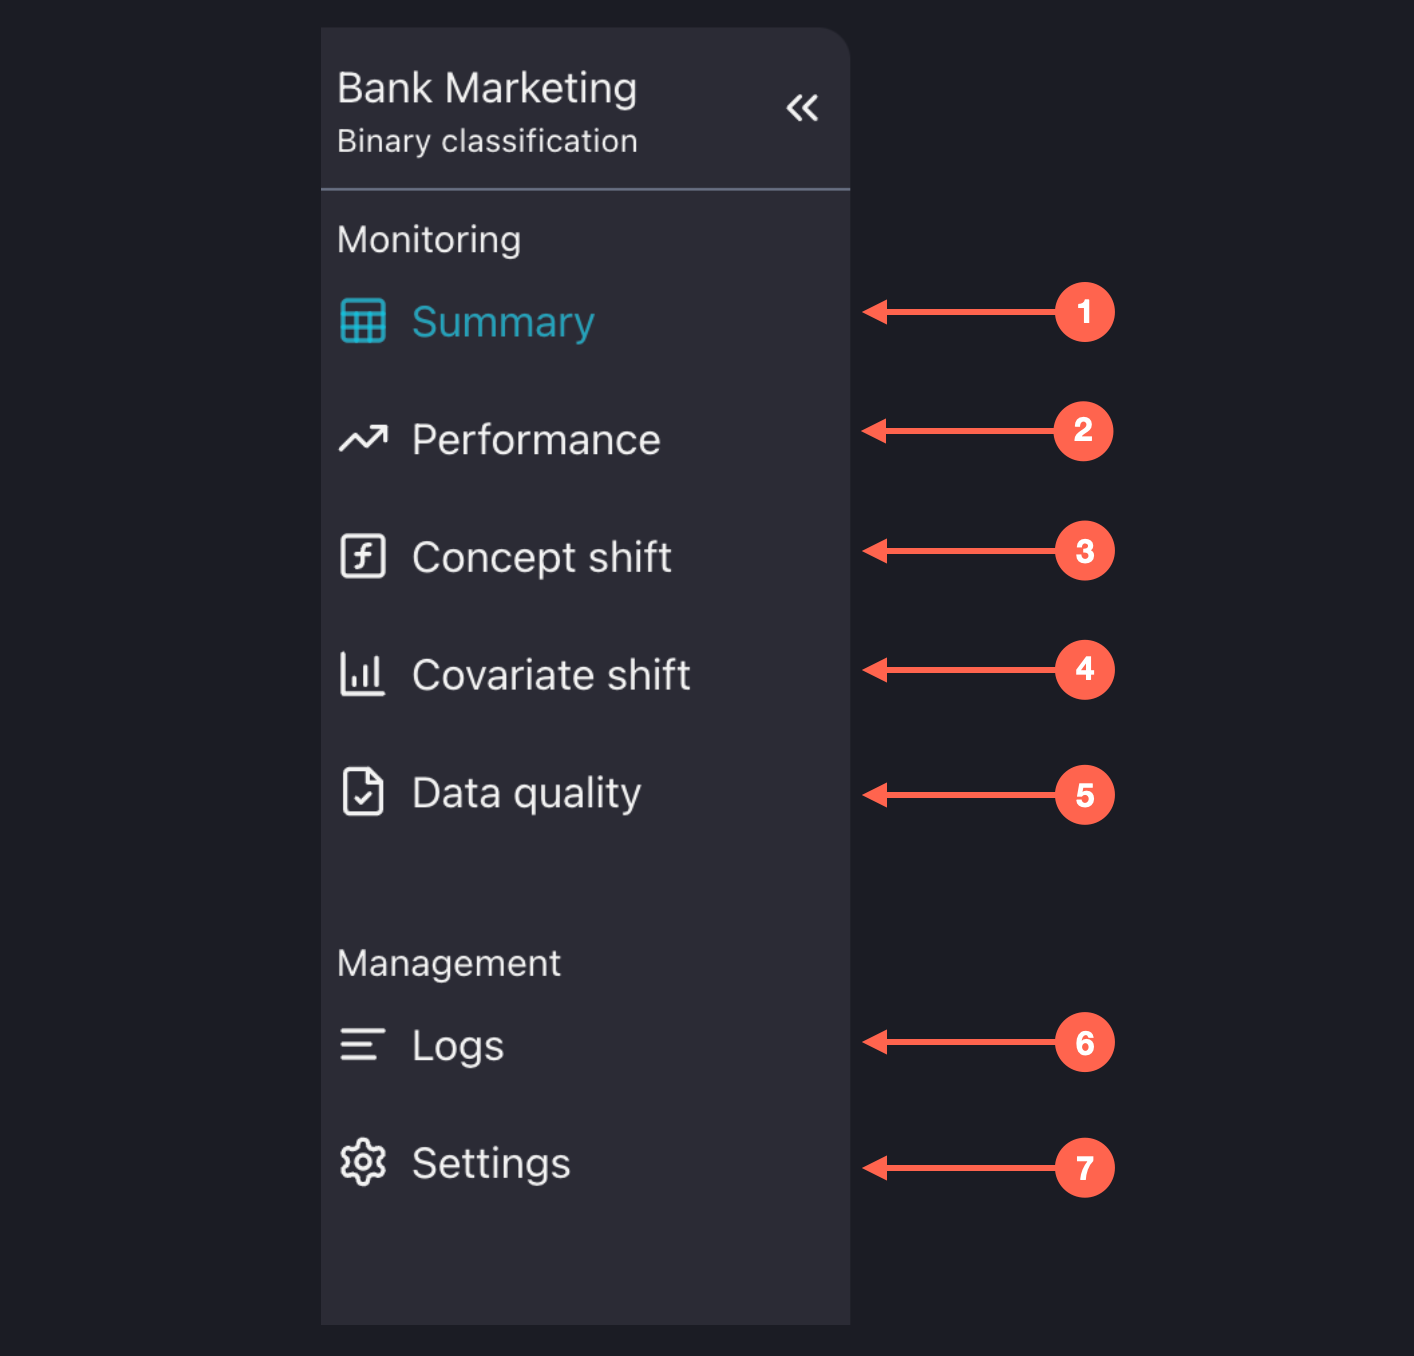
Model side panel
When you select a model from the model overview page, you will be redirected to the model summary page, which includes a side panel on the right. This panel helps you navigate through monitoring results, as well as model logs and settings.

These pages are ordered based on the importance and granularity of the analysis:
Summary Summaries are the most critical insights from the performance, concept shift, covariate shift, and data quality dashboard. Here, you can quickly find out if your model is still performing as expected or if it requires attention.
Performance Dashboard to analyze the relevant performance metrics.
Dashboard to analyze the impact and magnitude of concept shift.
Covariate shift Dashboard to analyze various covariate shift methods.
Data quality Dashboard to visualize unseen and missing values.
Logs Here, you can find the logs of the NannyML runs.
Model Settings This page is dedicated to the configuration of the monitored machine learning model.