NannyML Cloud
HomeBlogNannyML OSS Docs
v0.24.2
v0.24.2
  • ☂️Introduction
  • Model Monitoring
    • Quickstart
    • Data Preparation
      • How to get data ready for NannyML
    • Tutorials
      • Monitoring a tabular data model
      • Monitoring with segmentation
      • Monitoring a text classification model
      • Monitoring a computer vision model
    • How it works
      • Probabilistic Adaptive Performance Estimation (PAPE)
      • Reverse Concept Drift (RCD)
    • Custom Metrics
      • Creating Custom Metrics
        • Writing Functions for Binary Classification
        • Writing Functions for Multiclass Classification
        • Writing Functions for Regression
        • Handling Missing Values
        • Advanced Tutorial: Creating a MTBF Custom Metric
      • Adding a Custom Metric through NannyML SDK
    • Reporting
      • Creating a new report
      • Report structure
      • Exporting a report
      • Managing reports
      • Report template
      • Add to report feature
  • Product tour
    • Navigation
    • Adding a model
    • Model overview
    • Deleting a model
    • Model side panel
      • Summary
      • Performance
      • Concept drift
      • Covariate shift
      • Data quality
      • Logs
      • Model settings
        • General
        • Data
        • Performance settings
        • Concept Drift settings
        • Covariate Shift settings
        • Descriptive Statistics settings
        • Data Quality settings
    • Account settings
  • Deployment
    • Azure
      • Azure Managed Application
        • Finding the URL to access managed NannyML Cloud
        • Enabling access to storage
      • Azure Software-as-a-Service (SaaS)
    • AWS
      • AMI with CFT
        • Architecture
      • EKS
        • Quick start cluster setup
      • S3 Access
    • Application setup
      • Authentication
      • Notifications
      • Webhooks
      • Permissions
  • NannyML Cloud SDK
    • Getting Started
    • Example
      • Authentication & loading data
      • Setting up the model schema
      • Creating the monitoring model
      • Customizing the monitoring model settings
      • Setting up continuous monitoring
      • Add delayed ground truth (optional)
    • API Reference
  • Probabilistic Model Evaluation
    • Introduction
    • Tutorials
      • Evaluating a binary classification model
      • Data Preparation
    • How it works
      • HDI+ROPE (with minimum precision)
      • Getting Probability Distribution of a Performance Metric with targets
      • Getting Probability Distribution of Performance Metric without targets
      • Getting Probability Distribution of Performance Metric when some observations have labels
      • Defaults for ROPE and estimation precision
  • Experiments Module
    • Introduction
    • Tutorials
      • Running an A/B test
      • Data Preparation
    • How it works
      • Getting probability distribution of the difference of binary downstream metrics
  • miscellaneous
    • Engineering
    • Usage logging in NannyNL
    • Versions
      • Version 0.24.2
      • Version 0.24.1
      • Version 0.24.0
      • Version 0.23.0
      • Version 0.22.0
      • Version 0.21.0
Powered by GitBook
On this page
  • Release Notes
  • Reports
  1. miscellaneous
  2. Versions

Version 0.24.0

PreviousVersion 0.24.1NextVersion 0.23.0

Release Notes

We're happy to give you version 0.24.0!

This shiny new release brings us a new reporting feature!

Reports

NannyML now allows you to share information from within NannyML cloud with your coworkers by using the new reporting functionality. A report can contain structural elements such as titles and headers, any plot you can see in the NannyML Cloud web application and text blocks to provide your expertise alongside the plots.

Once you've finished editing the report, you can export it into a PDF or a PowerPoint presentation (PPTx), so it can easily be shared or presented.

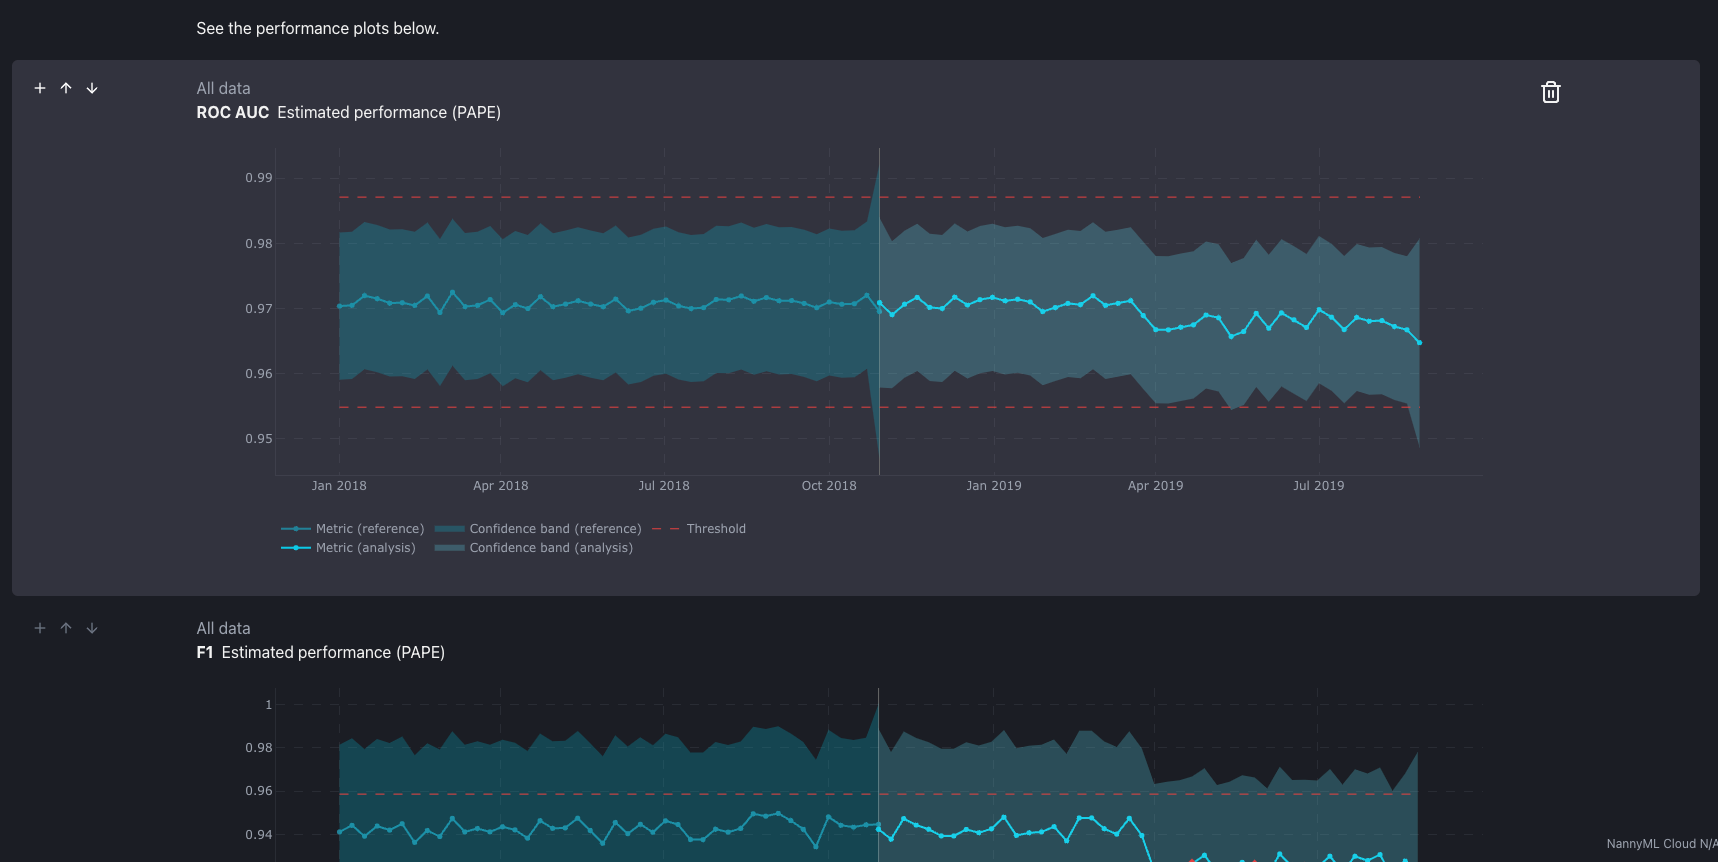
We'll give you some quick examples of how you can use reporting.

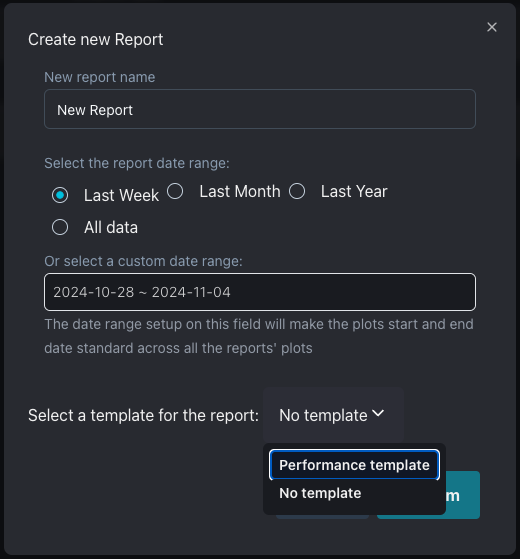
Quick and easy: use a template

By far the quickest and easiest way to "just get a report" is to create one by using a template. NannyML offers some self-assembled templates that can be instantiated using your monitored models. Just select a time range, a template and hit create!

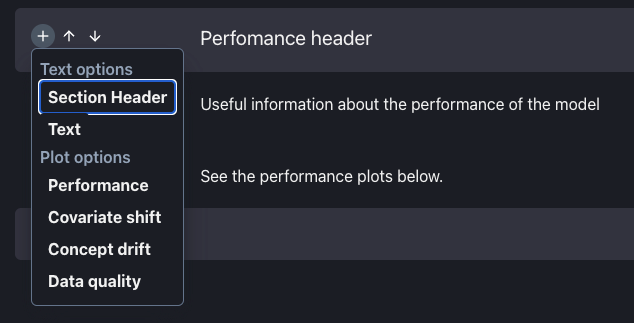
Do it yourself: report building

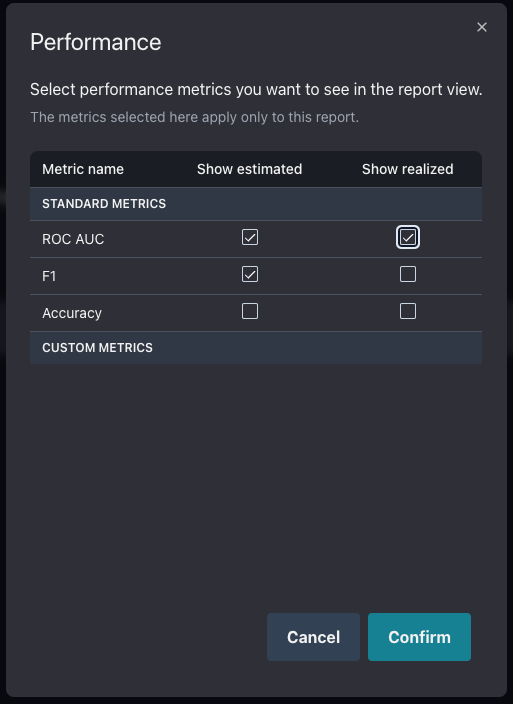
On the other side of the spectrum we have our report builder. After creating a report, you'll end up with a blank canvas. You can add any kind of element to this canvas, such as headers, text blocks or plots. A guide walks you through the steps of adding selecting and adding one or more plots. After adding all of your content to the report, you can use drag and drop functionality to organize it to your liking.

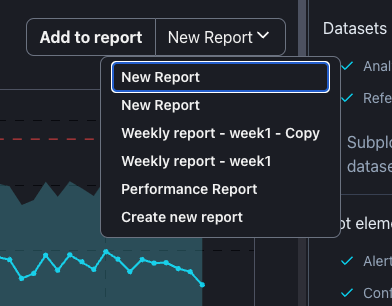
The shopping cart: the add to report button

Sometimes you're browsing through the NannyML Cloud web application and you bump into an interesting plot. Maybe your estimated F1 score is trending down. As you investigate, you navigate other plots, maybe some covariate shift or concept drift. From now on, all plots have a button that allows you to add it to a report (existing or new) as you're browsing through the web application, acting like a sort of clipping tool. This allows you to capture your train of thought inside a report as you investigate model performance issues. After snipping all relevant plots, you can edit the report to add more contextual information, your analysis, recommendations...

We hope you can build some rapport (haha!) with this new feature! Feel free to leave us any feedback!

Some report content
Creating from a template
Adding new "blocks" to a report
Selecting the plots you want add
Adding a report on the go