NannyML Cloud
HomeBlogNannyML OSS Docs
v0.24.2
v0.24.2
  • ☂️Introduction
  • Model Monitoring
    • Quickstart
    • Data Preparation
      • How to get data ready for NannyML
    • Tutorials
      • Monitoring a tabular data model
      • Monitoring with segmentation
      • Monitoring a text classification model
      • Monitoring a computer vision model
    • How it works
      • Probabilistic Adaptive Performance Estimation (PAPE)
      • Reverse Concept Drift (RCD)
    • Custom Metrics
      • Creating Custom Metrics
        • Writing Functions for Binary Classification
        • Writing Functions for Multiclass Classification
        • Writing Functions for Regression
        • Handling Missing Values
        • Advanced Tutorial: Creating a MTBF Custom Metric
      • Adding a Custom Metric through NannyML SDK
    • Reporting
      • Creating a new report
      • Report structure
      • Exporting a report
      • Managing reports
      • Report template
      • Add to report feature
  • Product tour
    • Navigation
    • Adding a model
    • Model overview
    • Deleting a model
    • Model side panel
      • Summary
      • Performance
      • Concept drift
      • Covariate shift
      • Data quality
      • Logs
      • Model settings
        • General
        • Data
        • Performance settings
        • Concept Drift settings
        • Covariate Shift settings
        • Descriptive Statistics settings
        • Data Quality settings
    • Account settings
  • Deployment
    • Azure
      • Azure Managed Application
        • Finding the URL to access managed NannyML Cloud
        • Enabling access to storage
      • Azure Software-as-a-Service (SaaS)
    • AWS
      • AMI with CFT
        • Architecture
      • EKS
        • Quick start cluster setup
      • S3 Access
    • Application setup
      • Authentication
      • Notifications
      • Webhooks
      • Permissions
  • NannyML Cloud SDK
    • Getting Started
    • Example
      • Authentication & loading data
      • Setting up the model schema
      • Creating the monitoring model
      • Customizing the monitoring model settings
      • Setting up continuous monitoring
      • Add delayed ground truth (optional)
    • API Reference
  • Probabilistic Model Evaluation
    • Introduction
    • Tutorials
      • Evaluating a binary classification model
      • Data Preparation
    • How it works
      • HDI+ROPE (with minimum precision)
      • Getting Probability Distribution of a Performance Metric with targets
      • Getting Probability Distribution of Performance Metric without targets
      • Getting Probability Distribution of Performance Metric when some observations have labels
      • Defaults for ROPE and estimation precision
  • Experiments Module
    • Introduction
    • Tutorials
      • Running an A/B test
      • Data Preparation
    • How it works
      • Getting probability distribution of the difference of binary downstream metrics
  • miscellaneous
    • Engineering
    • Usage logging in NannyNL
    • Versions
      • Version 0.24.2
      • Version 0.24.1
      • Version 0.24.0
      • Version 0.23.0
      • Version 0.22.0
      • Version 0.21.0
Powered by GitBook
On this page
  • New report options
  • Report creation
  1. Model Monitoring
  2. Reporting

Creating a new report

PreviousReportingNextReport structure

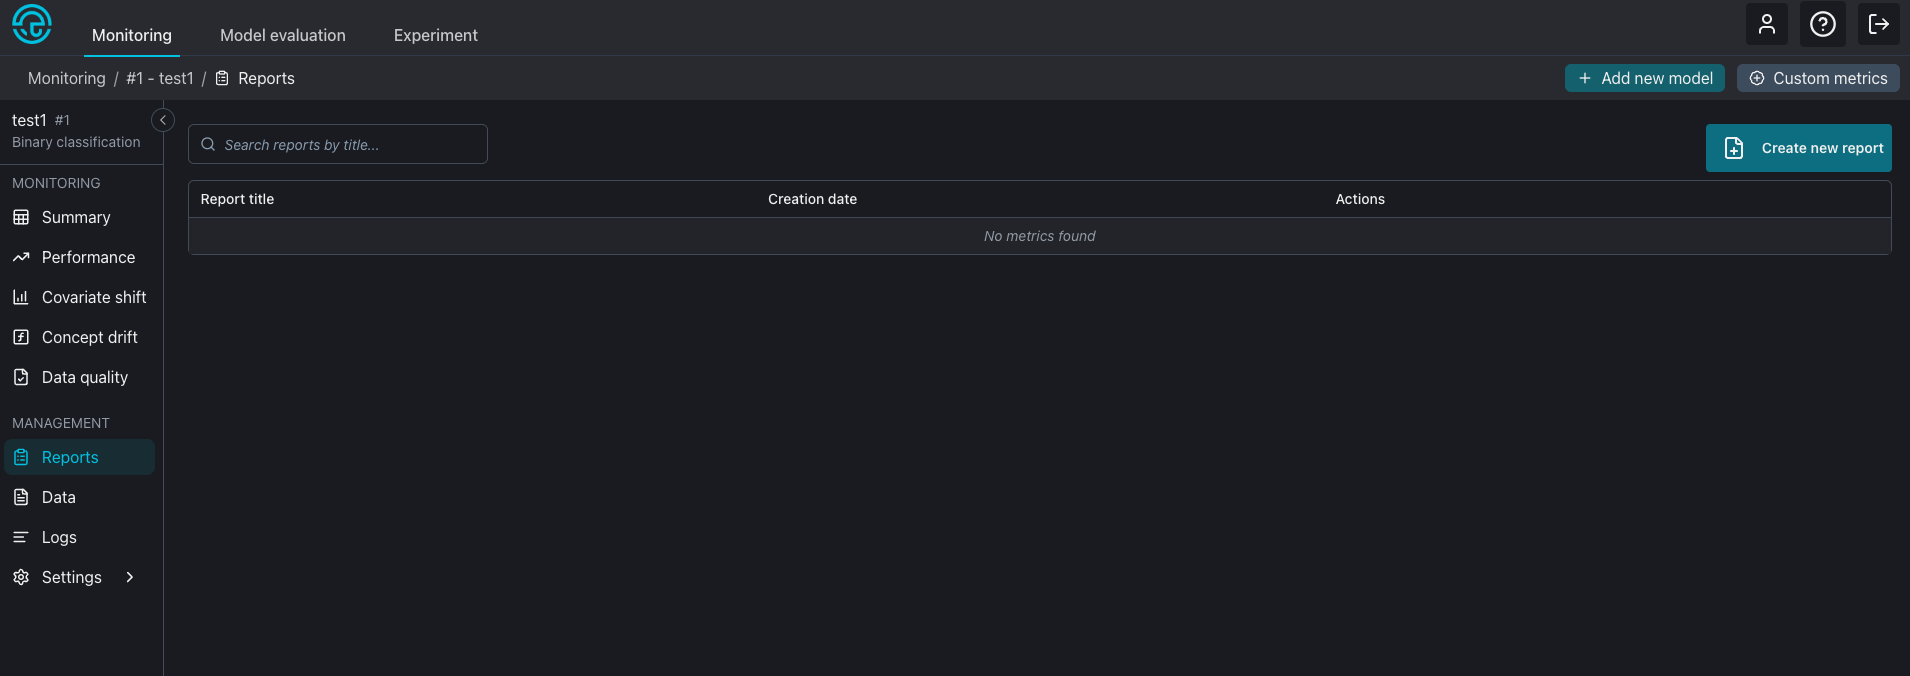
To create a report, a user can either navigate to the Report feature, by selecting a model, and clicking on Reports, in the left menu under Management. Then click on Create new report button on the top right screen.
It is also possible to create a new report from the Monitoring dashboards, like Performance, by clicking on the 'Create new report' button on the top of each plot.

New report options

By clicking on 'Create new report' button, a modal appears for the user to set up the initial report configuration.
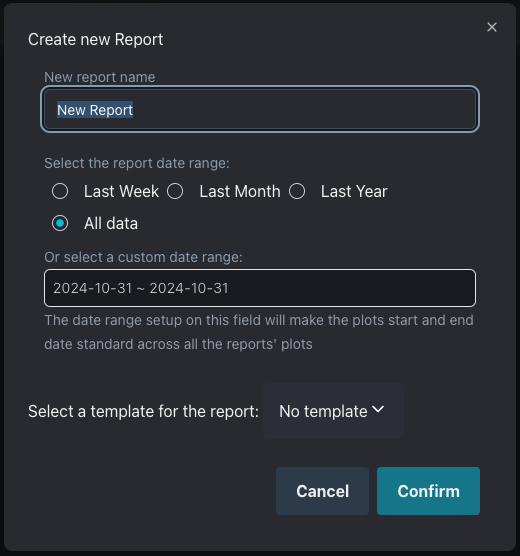
The user can set up a report name, date range and template.

Report name

The report name will be also the report title. If no new name is provided, the report will receive the name 'New Report'. The report name does not need to be unique and it can be changed later after the report is created.

Date range

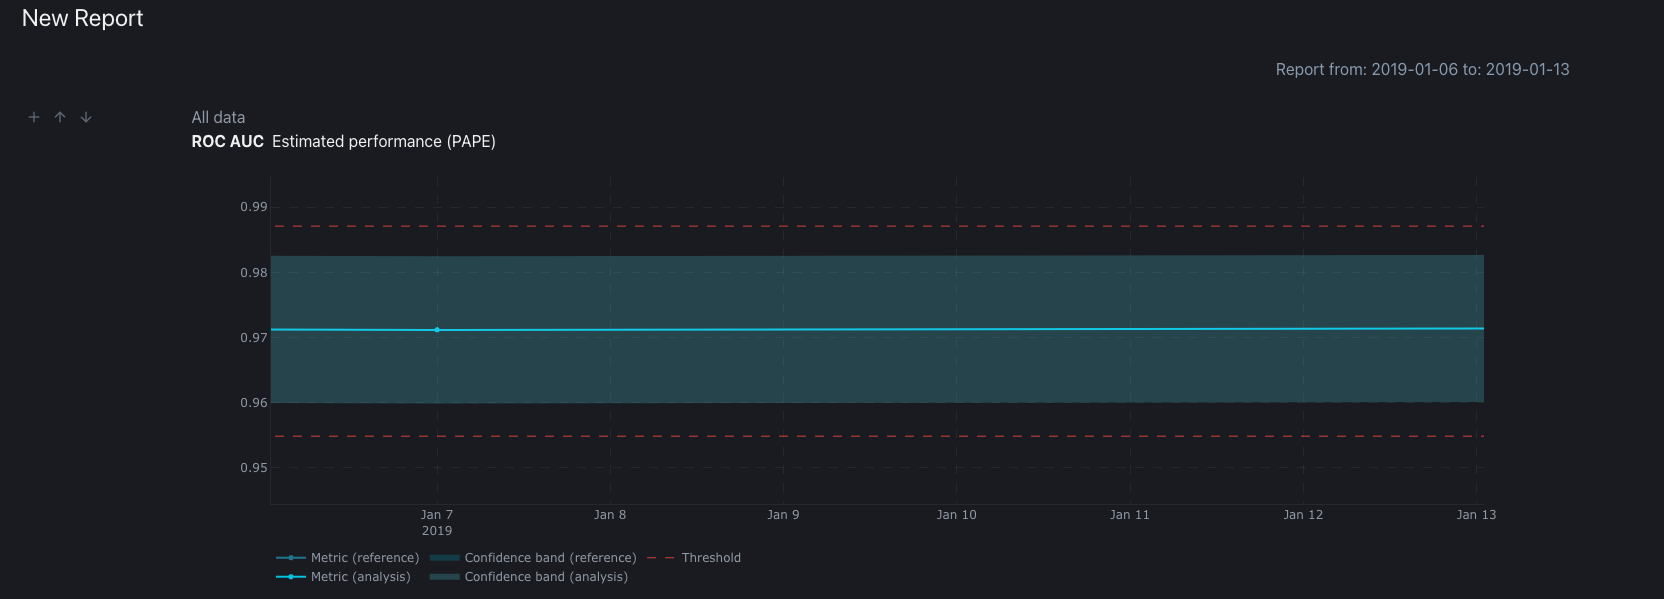
The report date range is the period of time the report represents. By default, the option 'All data' is selected, other options are 'Last Week' (last 7 days), 'Last Month' (last 30 days), 'Last Year' (last 365 days) and a custom date range. By defining a date range the user is saying that all the plots present on the report will have the defined start date and end date, making the report a snapshot in time.
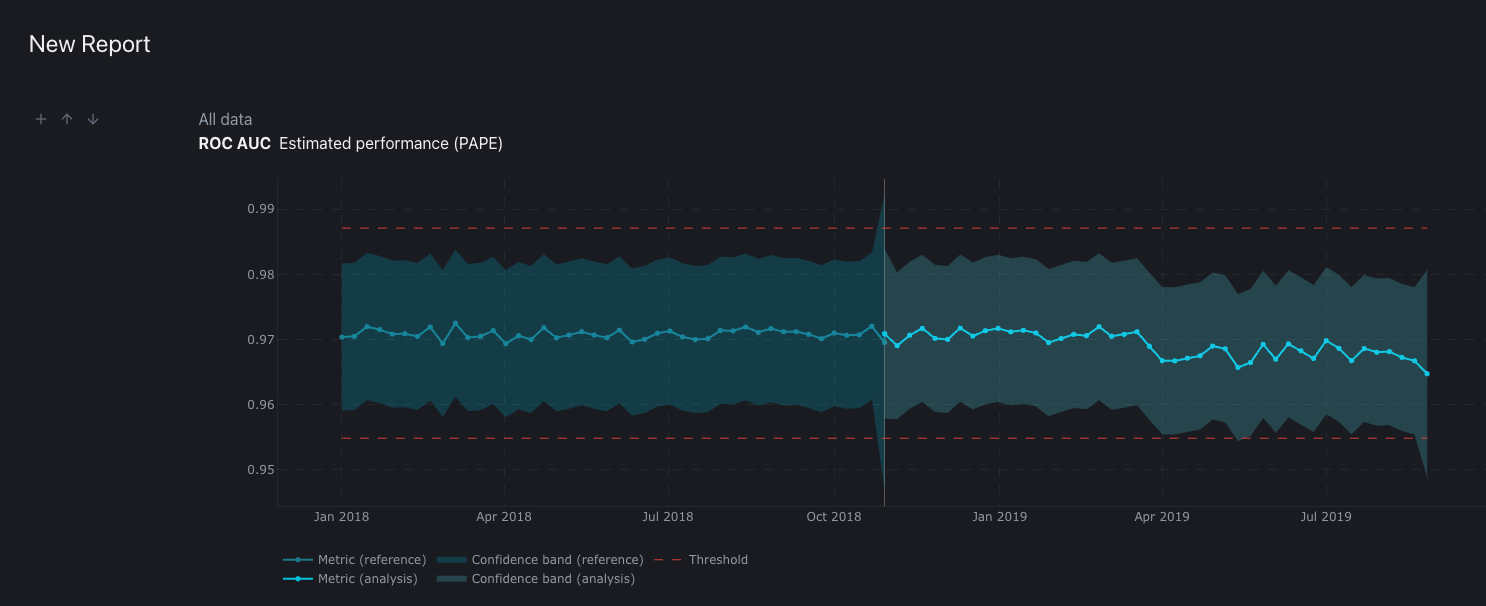
By selecting All data, the user will have, instead of a snapshot in time, the report date range starts on the first data point of the model's dataset and ends on the last data point. In this case every new datasets added to the model will affect the report plots by appending the new data over it.
The user needs to be aware that the report date range cannot be changed after the report creation and if the selected plot for the report has no data over the selected date range. no data will be displayed.

Template

The report template allows for a pre-filled report with plots and information about the data being displayed on the report. If alerts were identified on the reports's selected date range some technical information will be provided by the template.

Report creation

After the user clicks on 'Confirm', if on the Reports page, the user will be redirected to the newly created report and can start to editing/adding information to it. If the report is created from the Monitoring dashboard, the new report will appear on the 'Add to report' feature but the user will not be redirected to the new report.

Report with a date range from Jan 6th 2019 to Jan 13th 2019
All data report displays the plots with all the data available