NannyML Cloud
HomeBlogNannyML OSS Docs
v0.24.3
v0.24.3
  • ☂️Introduction
  • Model Monitoring
    • Quickstart
    • Data Preparation
      • How to get data ready for NannyML
    • Tutorials
      • Monitoring a tabular data model
      • Monitoring with segmentation
      • Monitoring a text classification model
      • Monitoring a computer vision model
    • How it works
      • Probabilistic Adaptive Performance Estimation (PAPE)
      • Reverse Concept Drift (RCD)
    • Custom Metrics
      • Creating Custom Metrics
        • Writing Functions for Binary Classification
        • Writing Functions for Multiclass Classification
        • Writing Functions for Regression
        • Handling Missing Values
        • Advanced Tutorial: Creating a MTBF Custom Metric
      • Adding a Custom Metric through NannyML SDK
    • Reporting
      • Creating a new report
      • Report structure
      • Exporting a report
      • Managing reports
      • Report template
      • Add to report feature
  • Product tour
    • Navigation
    • Adding a model
    • Model overview
    • Deleting a model
    • Model side panel
      • Summary
      • Performance
      • Concept drift
      • Covariate shift
      • Data quality
      • Logs
      • Model settings
        • General
        • Data
        • Performance settings
        • Concept Drift settings
        • Covariate Shift settings
        • Descriptive Statistics settings
        • Data Quality settings
    • Account settings
  • Deployment
    • Azure
      • Azure Managed Application
        • Finding the URL to access managed NannyML Cloud
        • Enabling access to storage
      • Azure Software-as-a-Service (SaaS)
    • AWS
      • AMI with CFT
        • Architecture
      • EKS
        • Quick start cluster setup
      • S3 Access
    • Application setup
      • Authentication
      • Notifications
      • Webhooks
      • Permissions
  • NannyML Cloud SDK
    • Getting Started
    • Example
      • Authentication & loading data
      • Setting up the model schema
      • Creating the monitoring model
      • Customizing the monitoring model settings
      • Setting up continuous monitoring
      • Add delayed ground truth (optional)
    • API Reference
  • Probabilistic Model Evaluation
    • Introduction
    • Tutorials
      • Evaluating a binary classification model
      • Data Preparation
    • How it works
      • HDI+ROPE (with minimum precision)
      • Getting Probability Distribution of a Performance Metric with targets
      • Getting Probability Distribution of Performance Metric without targets
      • Getting Probability Distribution of Performance Metric when some observations have labels
      • Defaults for ROPE and estimation precision
  • Experiments Module
    • Introduction
    • Tutorials
      • Running an A/B test
      • Data Preparation
    • How it works
      • Getting probability distribution of the difference of binary downstream metrics
  • miscellaneous
    • Engineering
    • Usage logging in NannyNL
    • Versions
      • Version 0.24.3
      • Version 0.24.2
      • Version 0.24.1
      • Version 0.24.0
      • Version 0.23.0
      • Version 0.22.0
      • Version 0.21.0
Powered by GitBook
On this page
  1. Model Monitoring
  2. Reporting

Report template

PreviousManaging reportsNextAdd to report feature

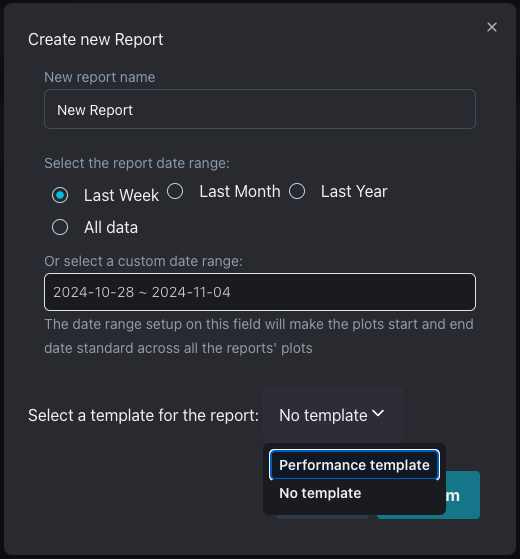
When selecting a template, the user will create a report with some pre-filled information prepared by NannyMl data scientists. If the model's dataset presents any alerts during the selected date range, there will be technical information about the alerts. These information may require some more business context from the user.
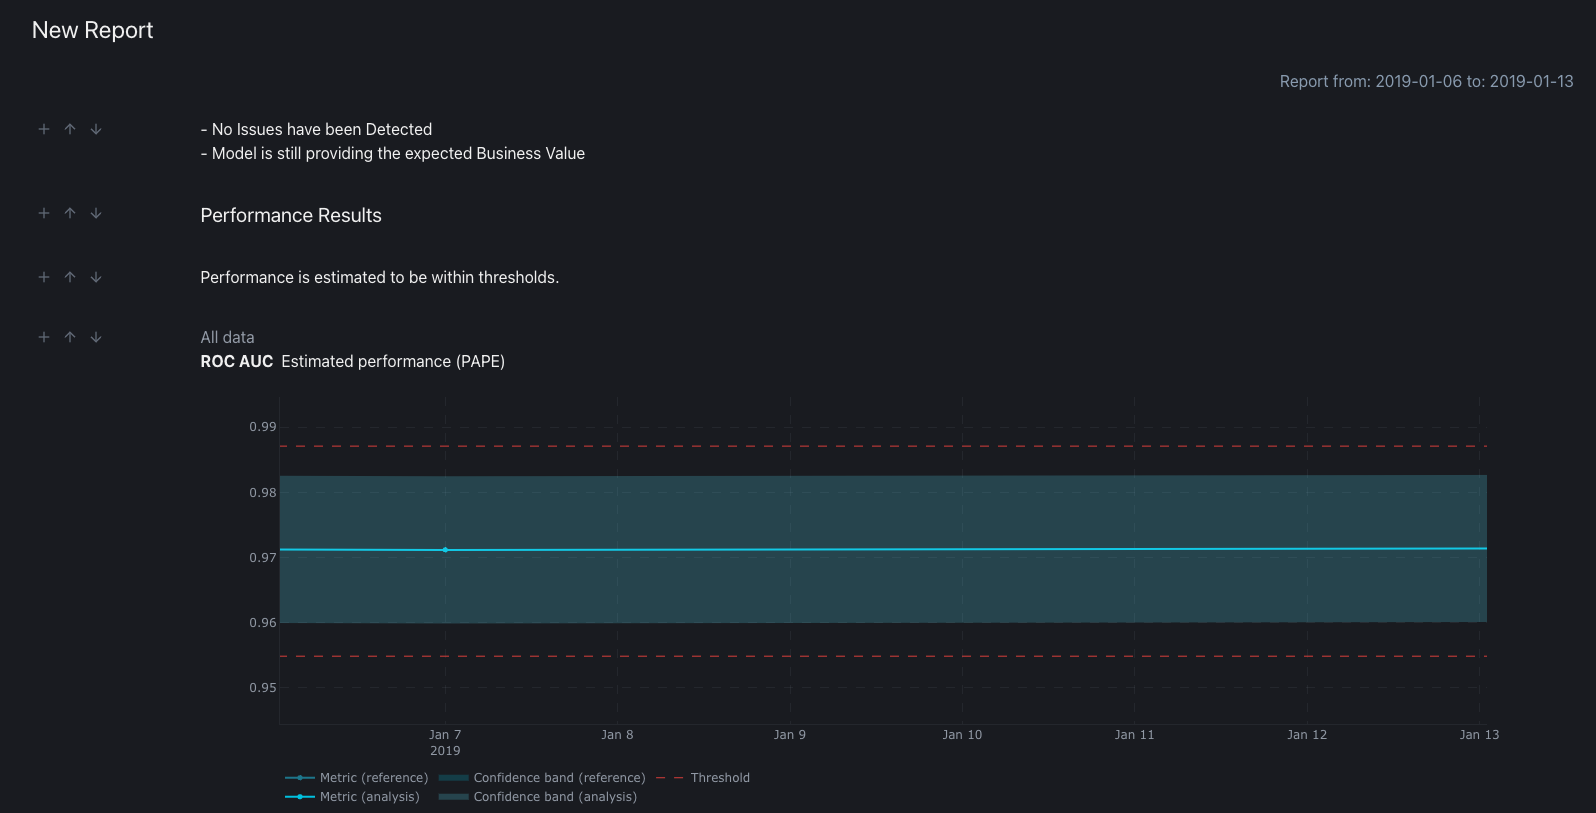
The auto generated performance template will look like this if the model's data set presents no alerts during the selected date range:
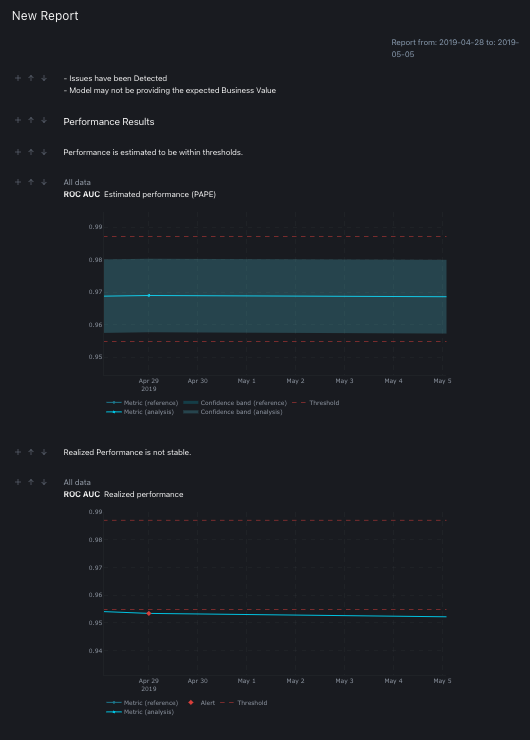
Otherwise, if there are alerts on the selected date range, the report text will reflect the alerts and inform the user.
Template versus Copying a report

The template report will generate some standard text related to the model's state during the selected date range. Copying a report will replicate the plots and the text information of the original report.

The template report will save the user some time on analyzing the model's performance during the selected date range. But the user would need to add some business context to the created report.

The copied report can be created by an original one containing all the required business information to explain the model's data set. But it will require an analysis of the model's state during the selected date range.

There is no point on copying an template report, copying the template report will keep all the original's text information. This means if the original report presents alerts during the its date range, all the alerts information will be kept even if no issues were detected on the new date range.

Report with alerts receive the information on the summary and on the plots which presented problems