Summary
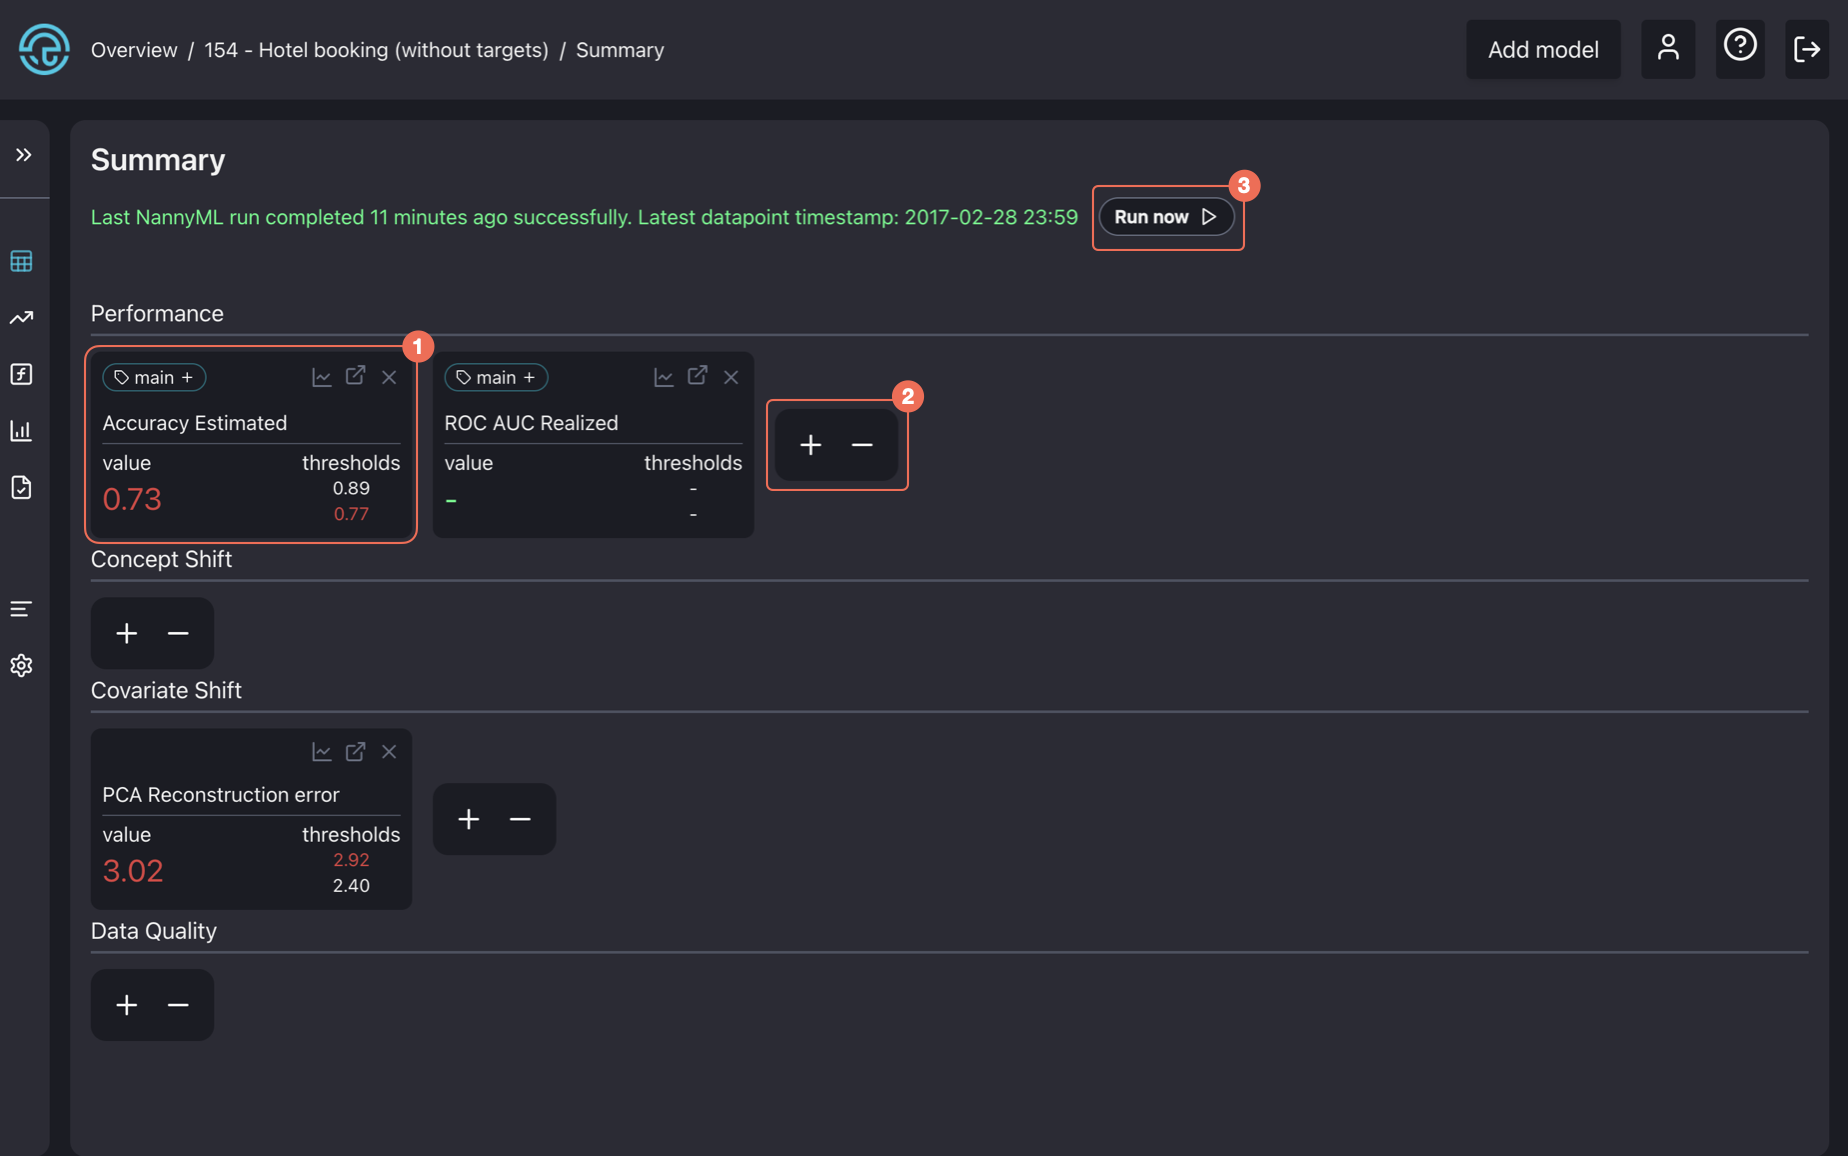
The first tab you can access in the side panel is the model summary page. It displays monitoring results for the most recent chunk for performance, concept shift, covariate shift, and data quality checks and notifies you whether there are any alerts.
Here is a video guide explaining how to use the model summary page:
Here, you will find a detailed description of three actionable items on the summary dashboard:

On the summary card, you have four actionable buttons:
Display a chart and look at the most important results by clicking on the plot icon.
Open results in a new browser tab.
Remove a card from the summary.
Change the main metric tag.

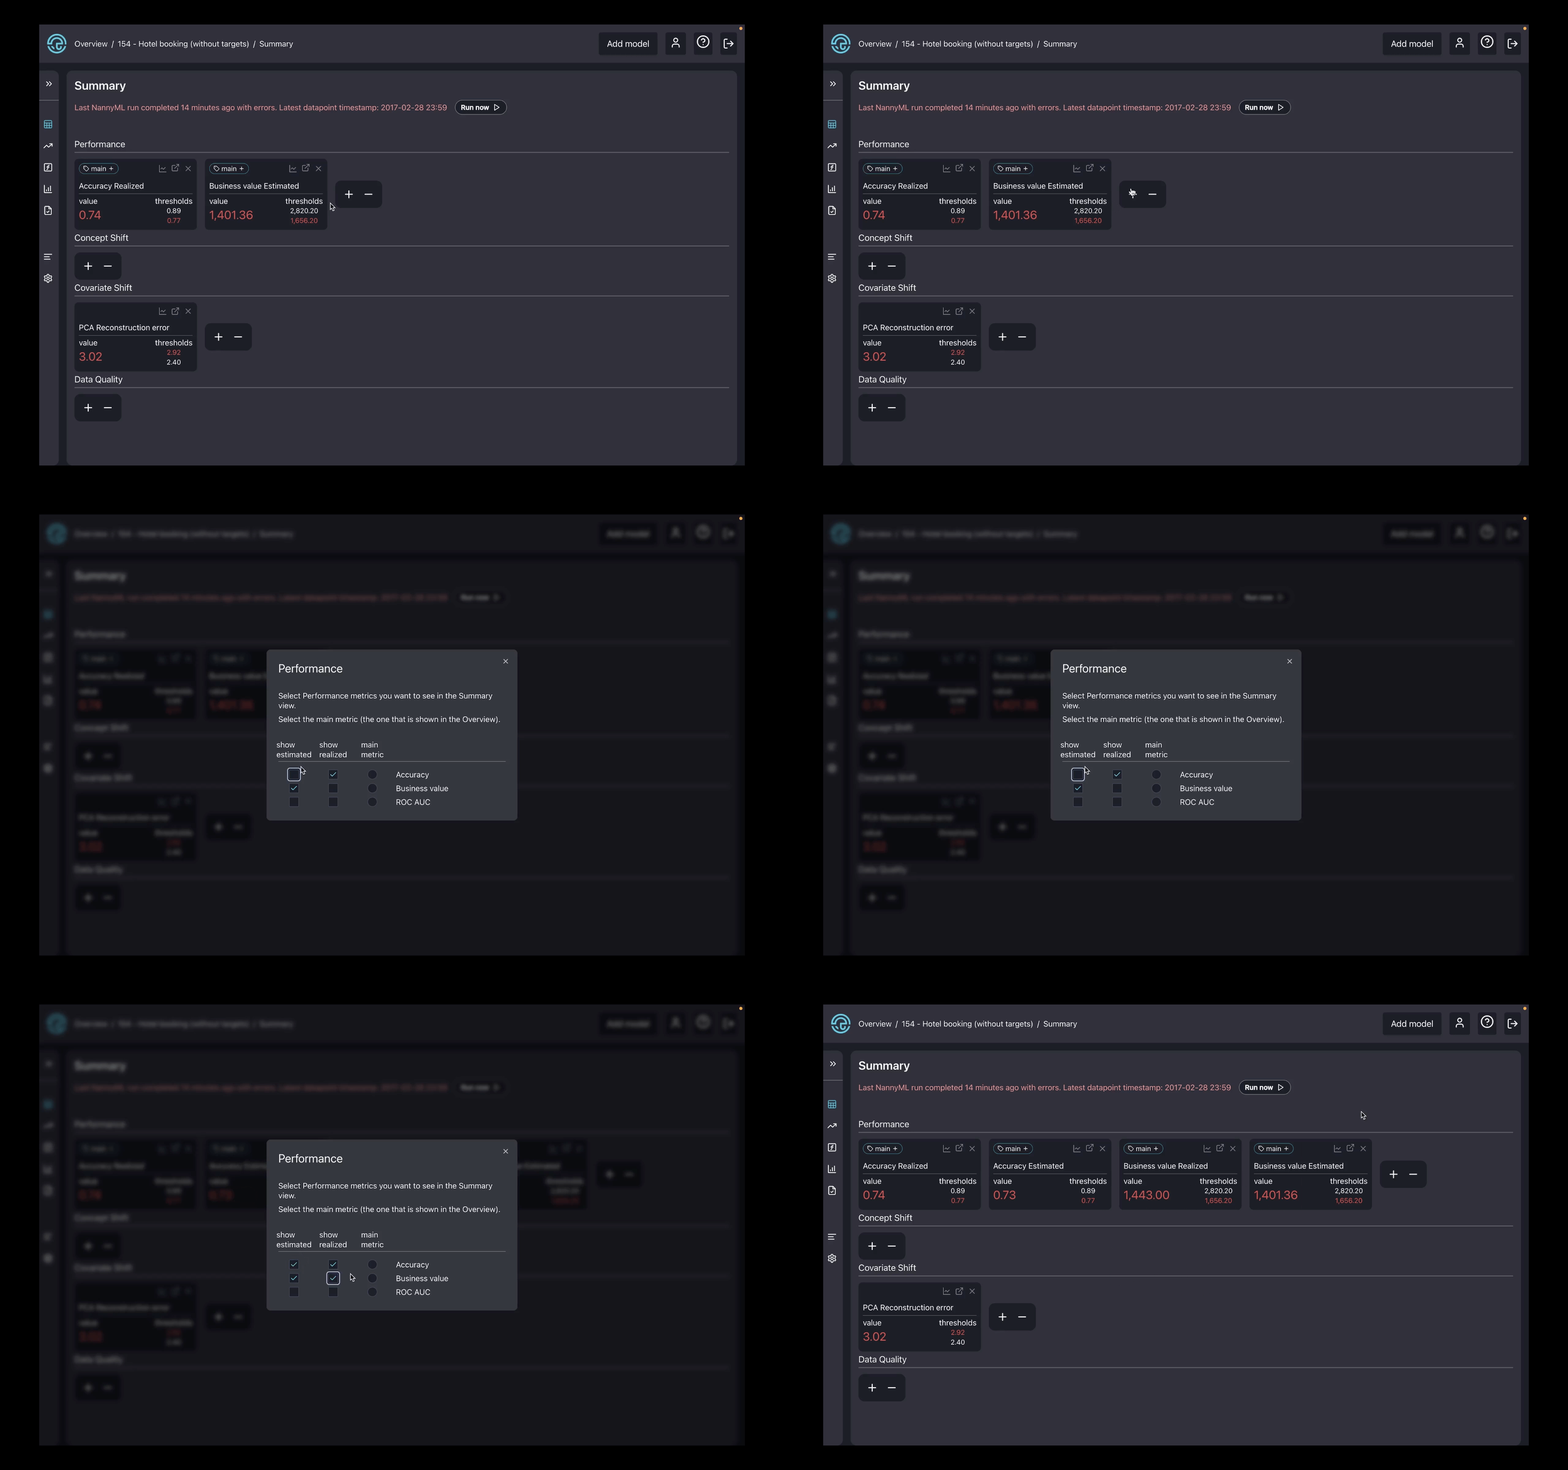
This button allows you to add or remove a summary card.

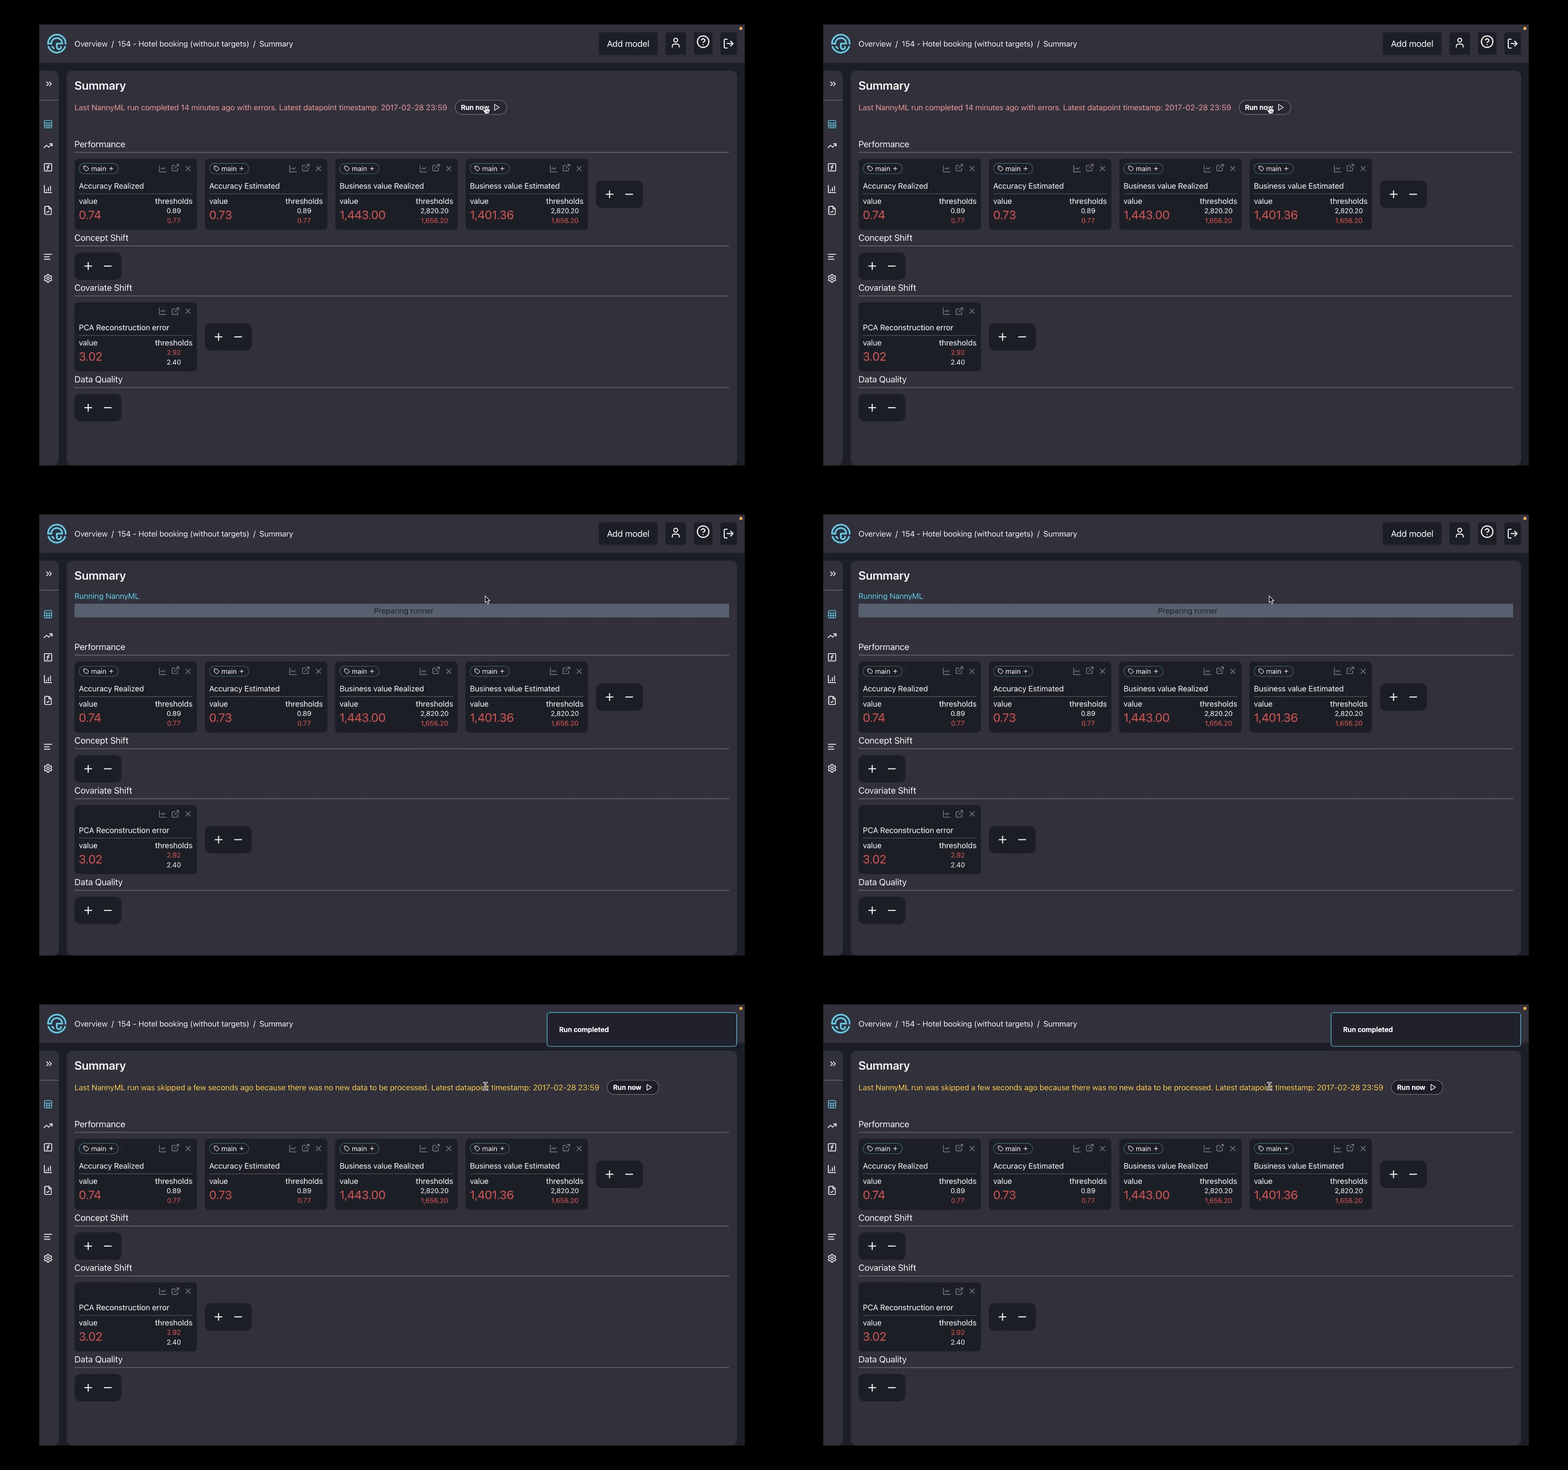
This button triggers a new monitoring run.

Every monitoring run can finish in one of three color-coded states: green, yellow, or red.
Green: Completed successfully

Yellow: Skipped because there are no new data to process

Red: Completed with errors
