Getting Probability Distribution of a Performance Metric with targets
This page describes how NannyML estimates probability distribution of a performance metric when the targets are available.
As described in the Introduction, Probabilistic Model Evaluation uses performance metric probability distribution estimated with the Bayesian approach. When the experiment data has targets, the task is relatively straightforward. The implementation details depend on the performance metric. Here, we will show how it is done for selected metrics.
Accuracy Score
To calculate the sample-level accuracy score, we can assign 1 to each correct prediction (when binary prediction is equal to the label) and 0 to each incorrect one. Then, we calculate the mean of these to get the accuracy point value. In the Bayesian approach, this leads to the binomial likelihood function. Using the binomial distribution convention - a correct prediction can be considered a success, while incorrect - a failure. In such a setting, the probability parameter of binomial distribution becomes accurate. Let's denote population-level accuracy as acc, the number of successful (correct) predictions as s and all the observations as n. The likelihood function can then be written as:
Likelihood function assigns the likelihood of observing a data s,n given that the population-level accuracy is equal to x. We are interested in the opposite, that is what is the population-level accuracy distribution given the data we observed. We can use Bayes Theorem to get it:
The P(acc=x∣s,n) term is the posterior probability distribution of accuracy given data. We already know the likelihood function. P(acc=x) is the prior - the belief that we have about the accuracy before we observed the data. P(s,n) is the normalizing constant which ensures that posterior is a proper probability - that is it integrates to 1.
Currently, NannyML uses a default uniform prior that assigns equal probability to each possible accuracy value in the range of 0-1. Such prior can be expressed with a Beta distribution with parameters αprior=1,βprior=1. Since it happens to be a conjugate prior for the binomial likelihood function, we get a closed-form analytical solution for the posterior, which is another Beta distribution with parameters αposterior=αprior+s, βposterior=βprior+n−s. That also adds intuitive interpretation for the prior Beta parameters - they can be treated as pseudo counts (or just come from the posterior distribution of previous experiments if available).
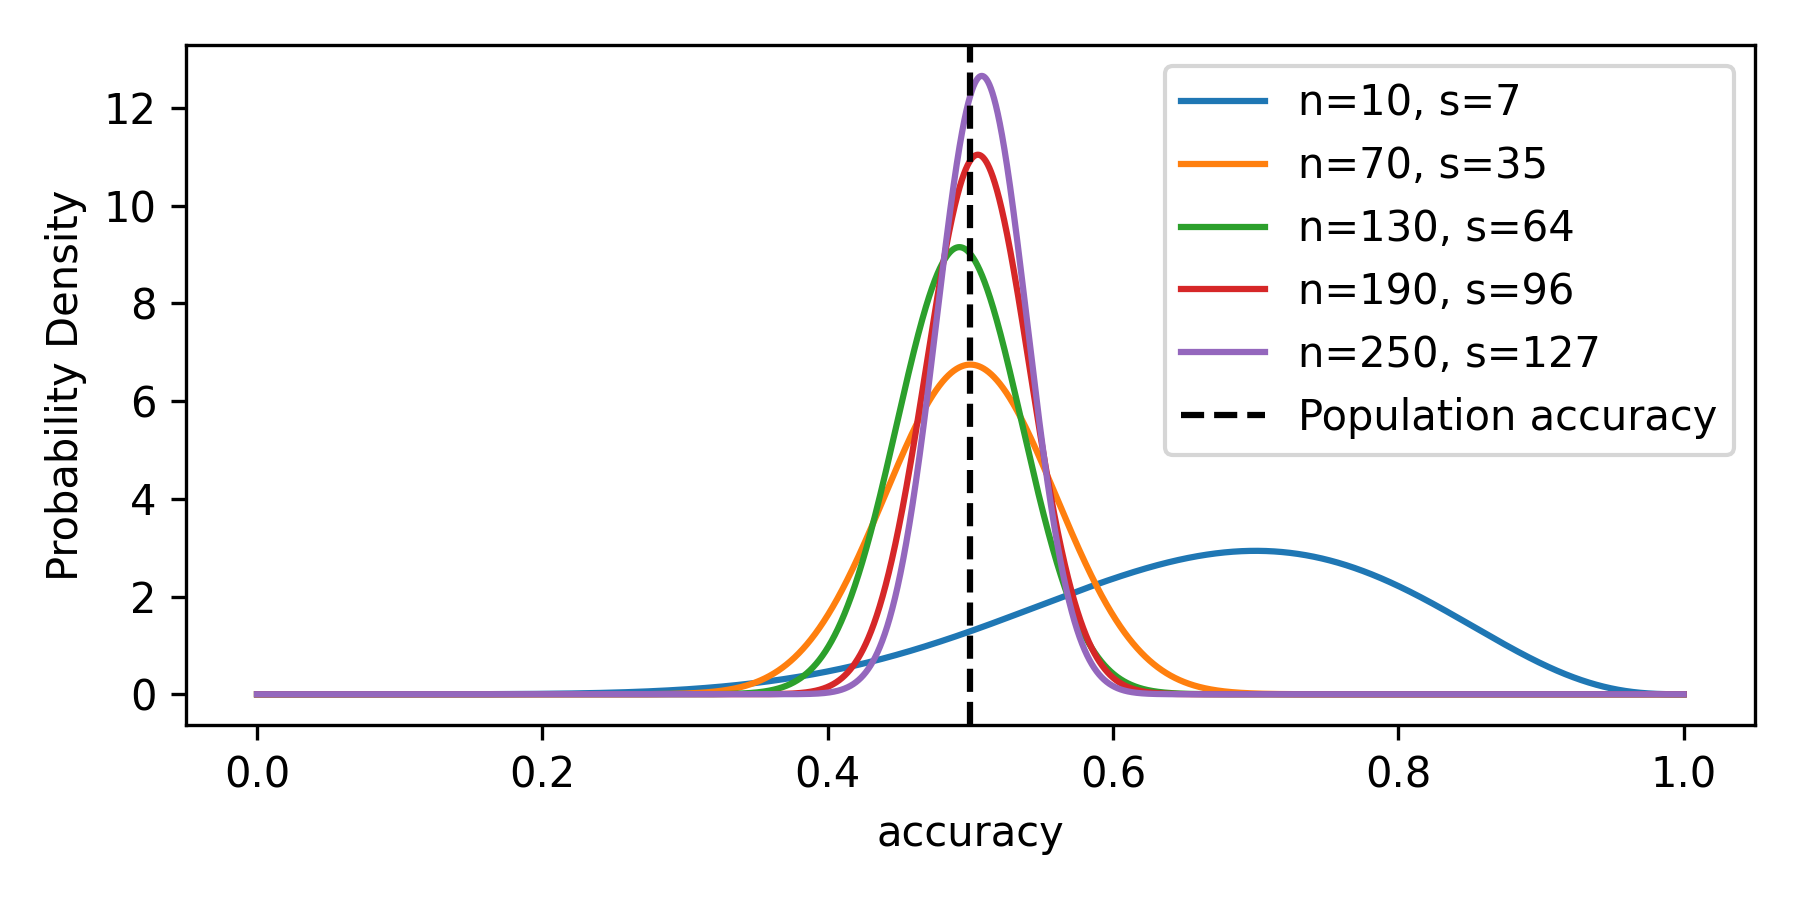
Figure 1 shows how the posterior probability distribution of accuracy updates with more observed data. The true population-level value of accuracy is 0.5 as the data simulates a model that randomly assigns positive predictions to randomly generated positive targets, all at the probability of 0.5.

Precision and Recall
Precision and recall posteriors are estimated similarly to accuracy. For precision, the s parameter of the binomial likelihood function is the sum of true positive predictions (as this is the numerator of the precision score). At the same time, n becomes the number of positive predictions (since this is the denominator). For recall, s is the same as for the precision, but n is the count of positive targets.
F1
For F1, we cannot directly use the binomial likelihood function (and beta prior/posterior) because it does not fit the success-out-of-n-trials model. Sample F1 is calculated with the following formula:
Three elements of the confusion matrix here (tp, fp, fn) are not independent. In that case, we model all confusion matrix elements at once. The likelihood function becomes a multinomial distribution with a probability vector containing four parameters - one for each confusion matrix element. Again, we apply a uniform prior and use conjugate distribution for multinomial likelihood - the Dirichlet distribution. As a posterior, we get another Dirichlet distribution with the following parameters:
where α1=α2=α3=α4=1 are prior pseudocounts, and TP,FP,TN,FN are confusion matrix elements. We then sample multiple times the population-level expected confusion matrix elements and calculate F1 as a deterministic variable.
ROC AUC
For ROC AUC, we take advantage of its being equal to the Mann-Whitney U test statistic and estimate its posterior using the approach described here.