Monitoring with segmentation
This tutorial explains what segmentation is, why you should use it, how you can use it, and its limitations.
What is segmentation
Segmentation is a feature in NannyML Cloud that allows you to split your data into groups (called segments) and analyze them separately. Each column from a dataset can be selected for segmentation, with segments created for each of the distinct values within that column.
For example, a dataset containing a feature called "country" with three distinct values: US, Canada, and Mexico can be selected for segmentation. We can then monitor performance, covariate shift, concept drift, and data quality issues at the segment level. That is, we could examine how the model is performing for instances where the country is the United States, for example.
Why you should use segmentation
Segmentation allows data scientists to understand how a model is performing on a specific subset of a population, adding interpretability to monitoring. Monitoring specific segments further helps you detect which segments are responsible for the deterioration in model performance.
With segmentation, we can identify whether new patterns emerge or old patterns become obsolete in specific segments. This is particularly useful when detecting concept drift using segmentation. While the overall dataset may not show signs of concept drift, individual subsets might.
For instance, consider a model predicting sales for a particular sneaker model. Although the overall relationship between the model's features and output might remain stable, it could change within a subset of the population. For example, sales might increase significantly among younger customers if a particular influencer boosts the sneaker's popularity among them.
How to use segmentation
To configure a model in NannyML Cloud, follow a few simple steps in the quickstart guide. There are two ways to configure segmentation for a model in NannyML Cloud:
During model configuration: When configuring the model inputs while uploading a new model to NannyML Cloud, you can optionally indicate the columns you wish to use for segmentation. This can be done by selecting specific columns using the "Segment by" dropdown menu or by selecting the "Segment by" flag for specific columns.
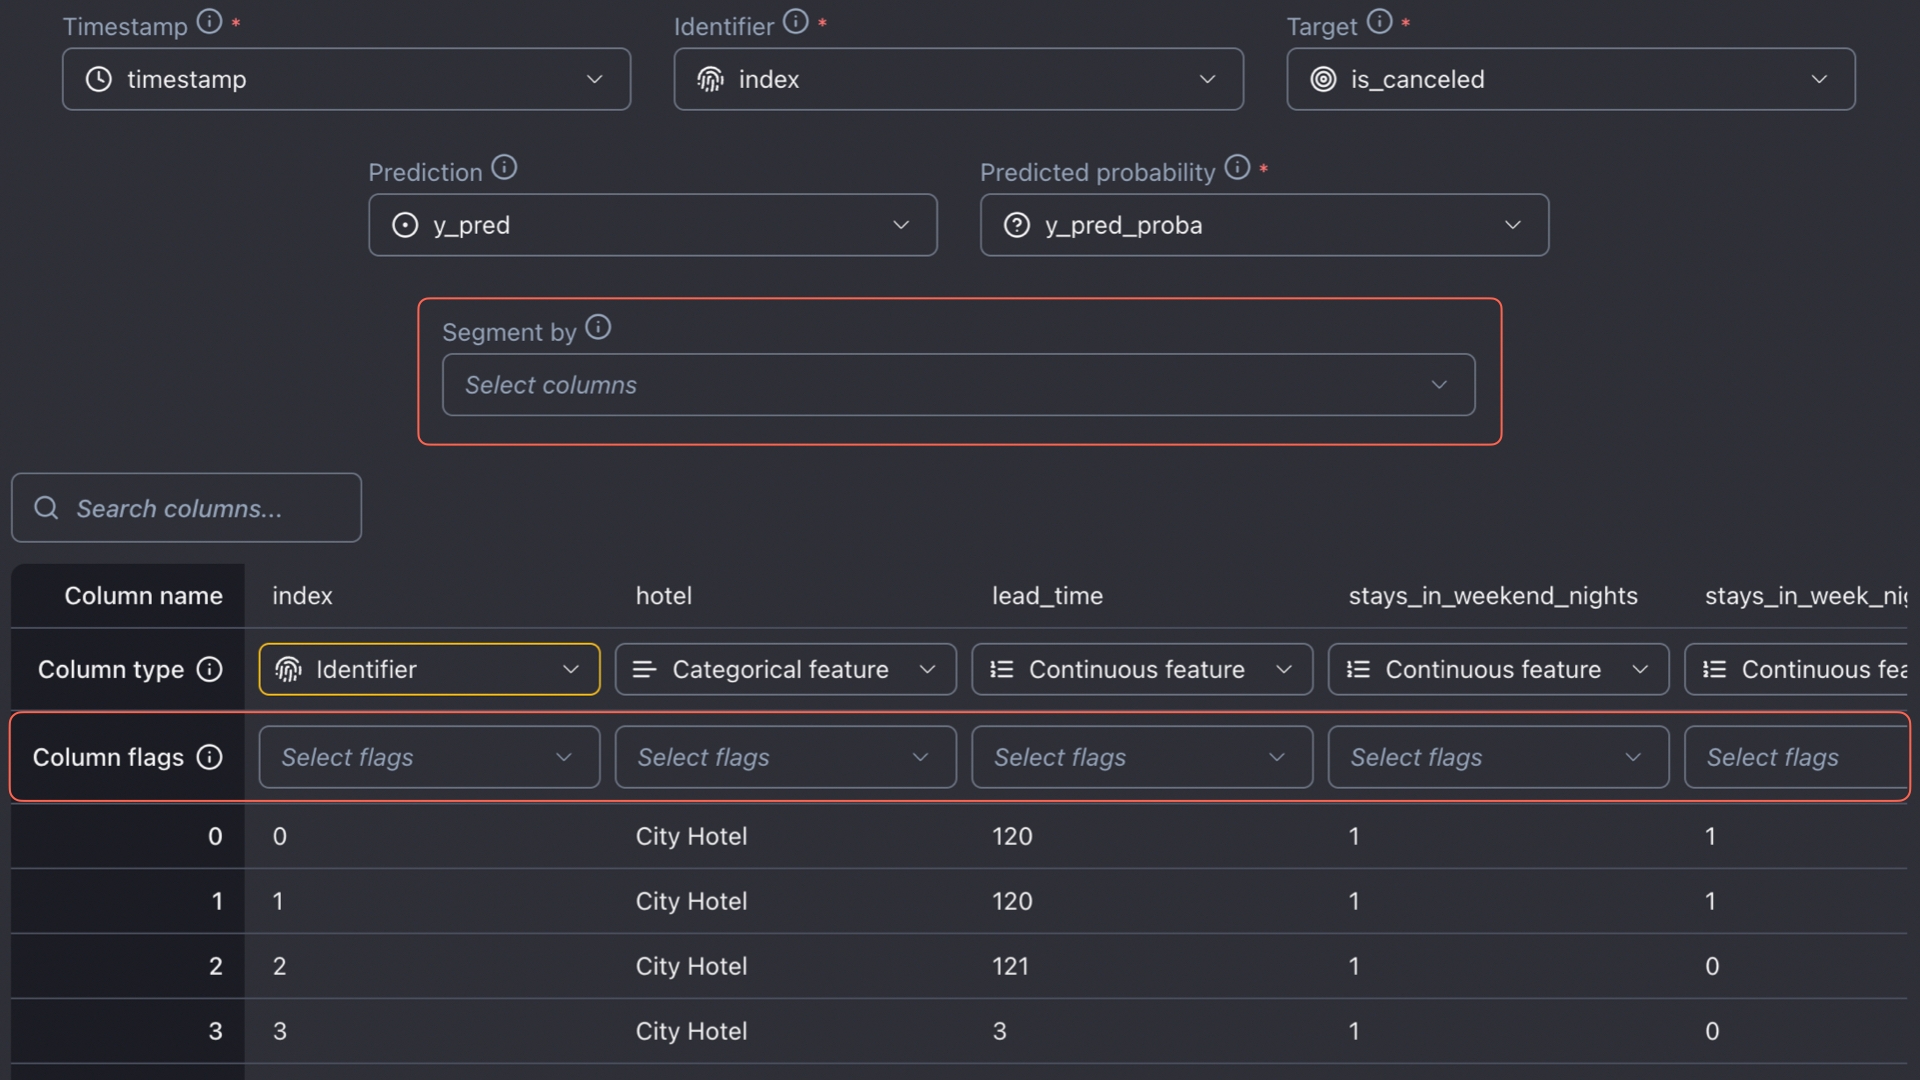
Adding segmentation in model configuration In model settings: After a model has been created in NannyML Cloud, it is still possible to create segments. Go to the model settings and then to the Data tab. You can then configure segments similarly to how it is explained above.
When selecting a column for segmentation, different segments are created for each unique value within that column. However, if you wish to create combined segments, some feature engineering is required. For example, consider a model that contains the features "country" and "gender." Selecting each column for segmentation will create segments for each country and each gender separately. If you wish to create combined features, such as US-women or Canada-men, you need to create a new feature that combines both columns.
For continuous columns, you should also create an extra column that represents different ranges as segments. For example, if we have an age feature, it might be useful to create different categories such as 20-30 years old, 30-40 years old, etc. The choice of discretization should be based on business usefulness.
Monitoring with segmentation
Now we will illustrate how segmentation can improve your ML model monitoring. We build on our existing tutorial on how to monitor an ML model that predicts hotel booking cancellations. Additionally, we have a webinar that walks through this particular example to demonstrate how segmentation can help detect a failing model.
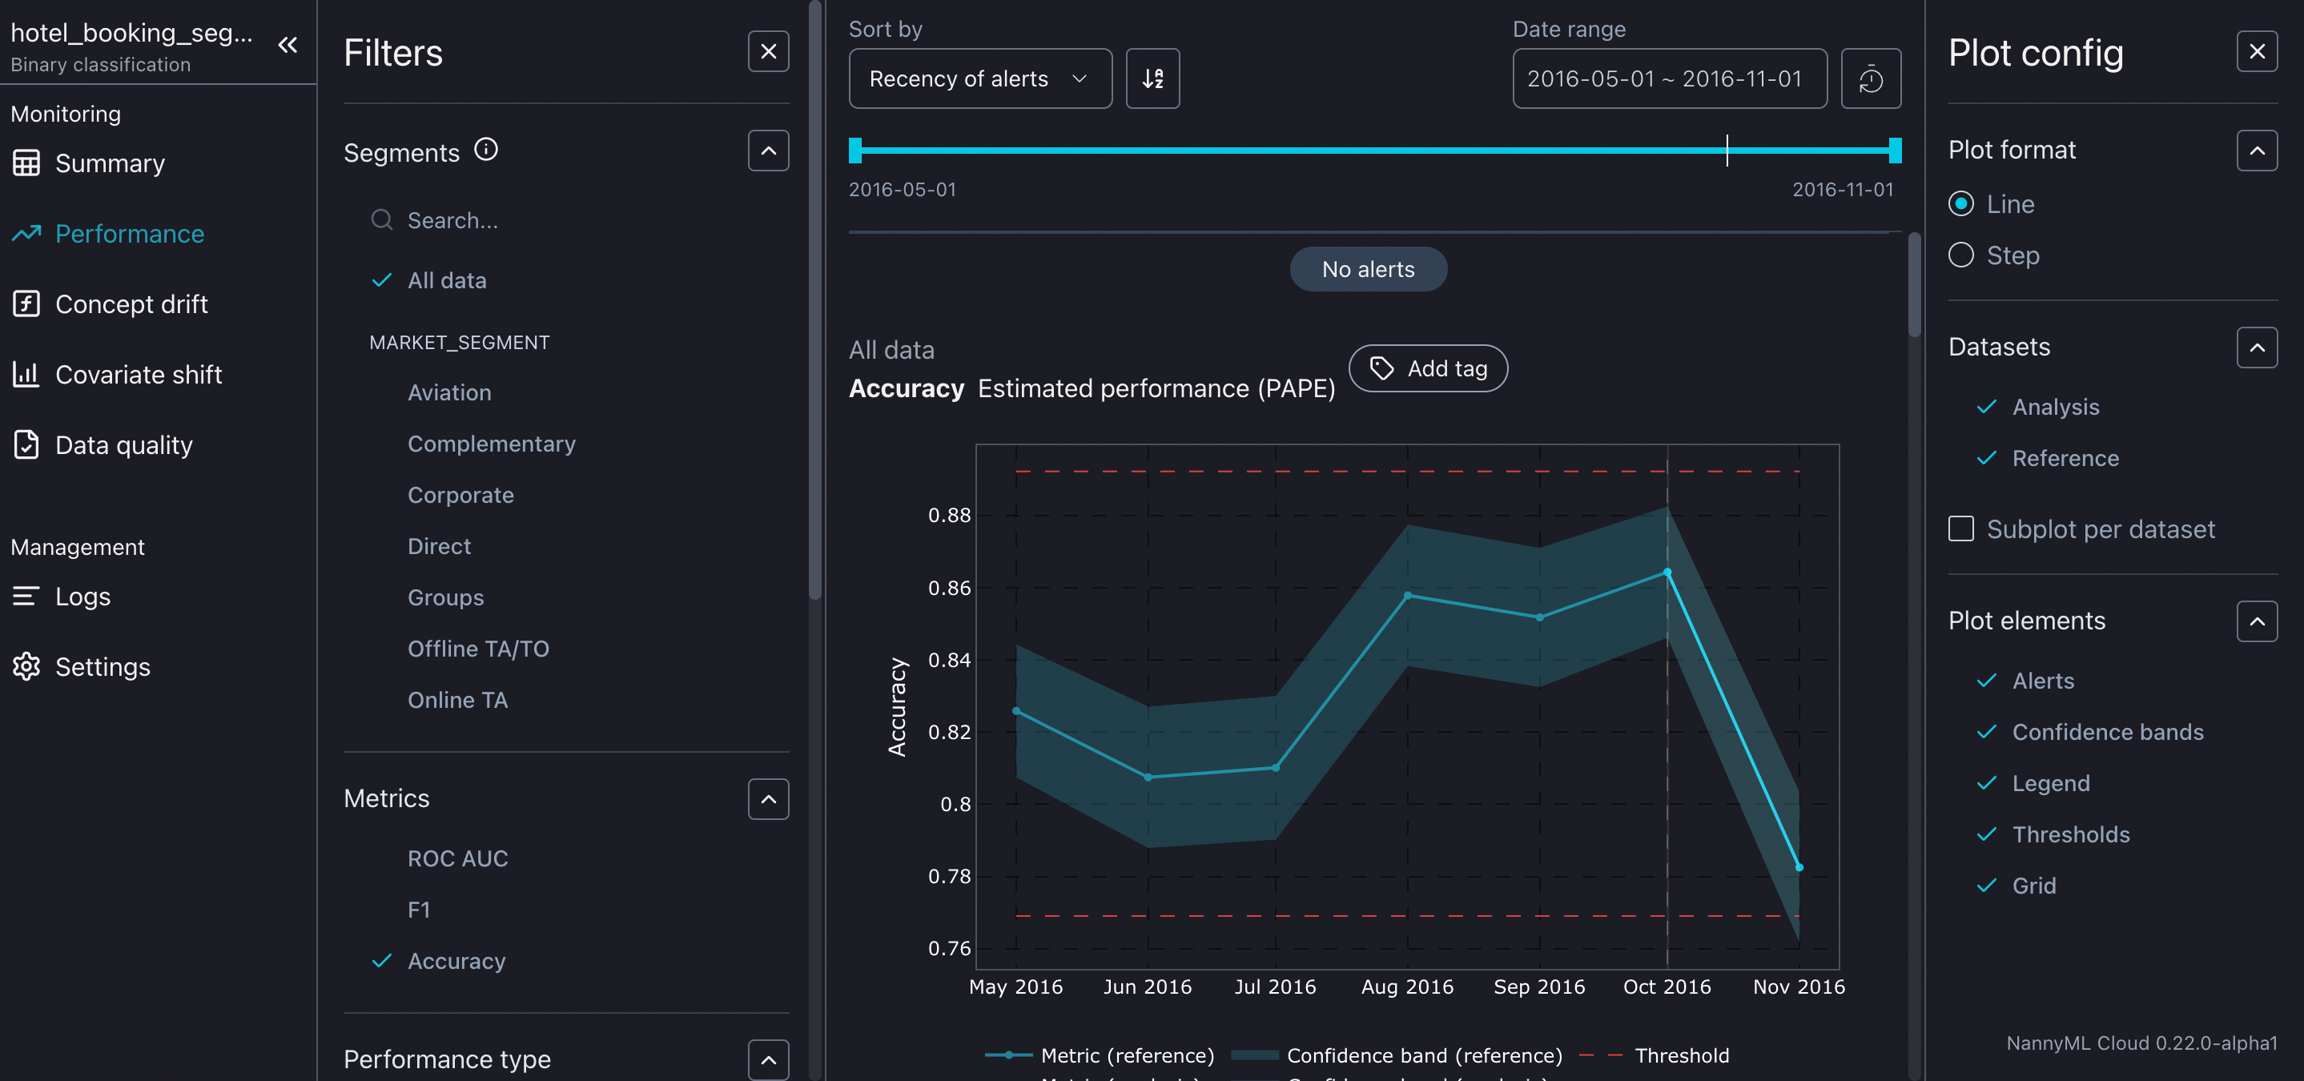
One of the features used in the model predicting hotel booking cancellations is "market_segment". The values this feature can assume include Groups, Direct, and Corporate. We will focus on analyzing the Groups segment, as a broader analysis showed this segment to be a potential reason for a drop in model performance. This means analyzing the subset of the entire dataset where maktet_segment is Groups. When monitoring expected performance using PAPE, we observe that the model is expected to perform well on the entire dataset, while the expected performance of the segment where market_segment is Groups falls below the preset threshold for performance.
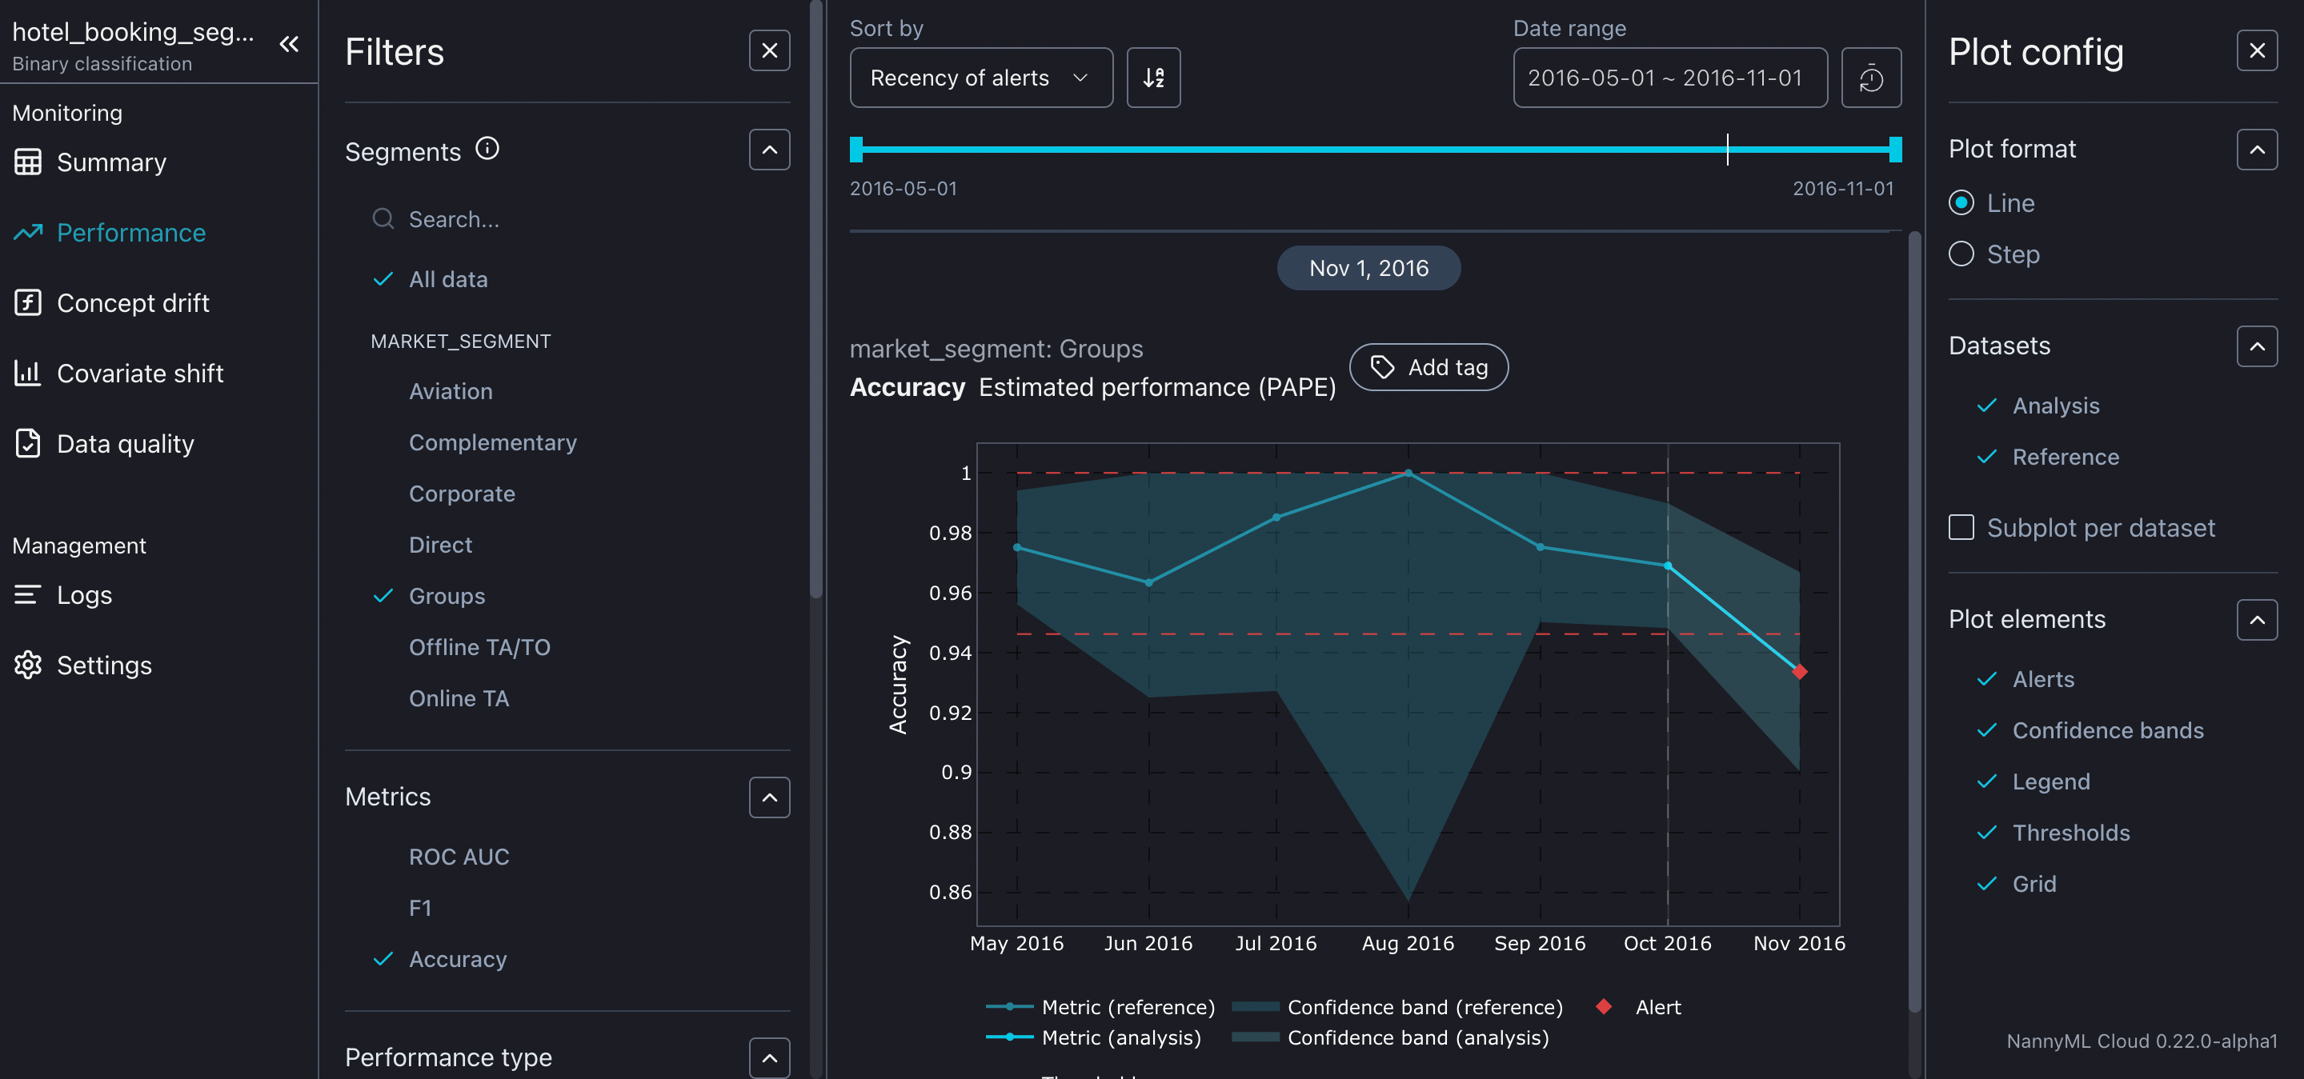
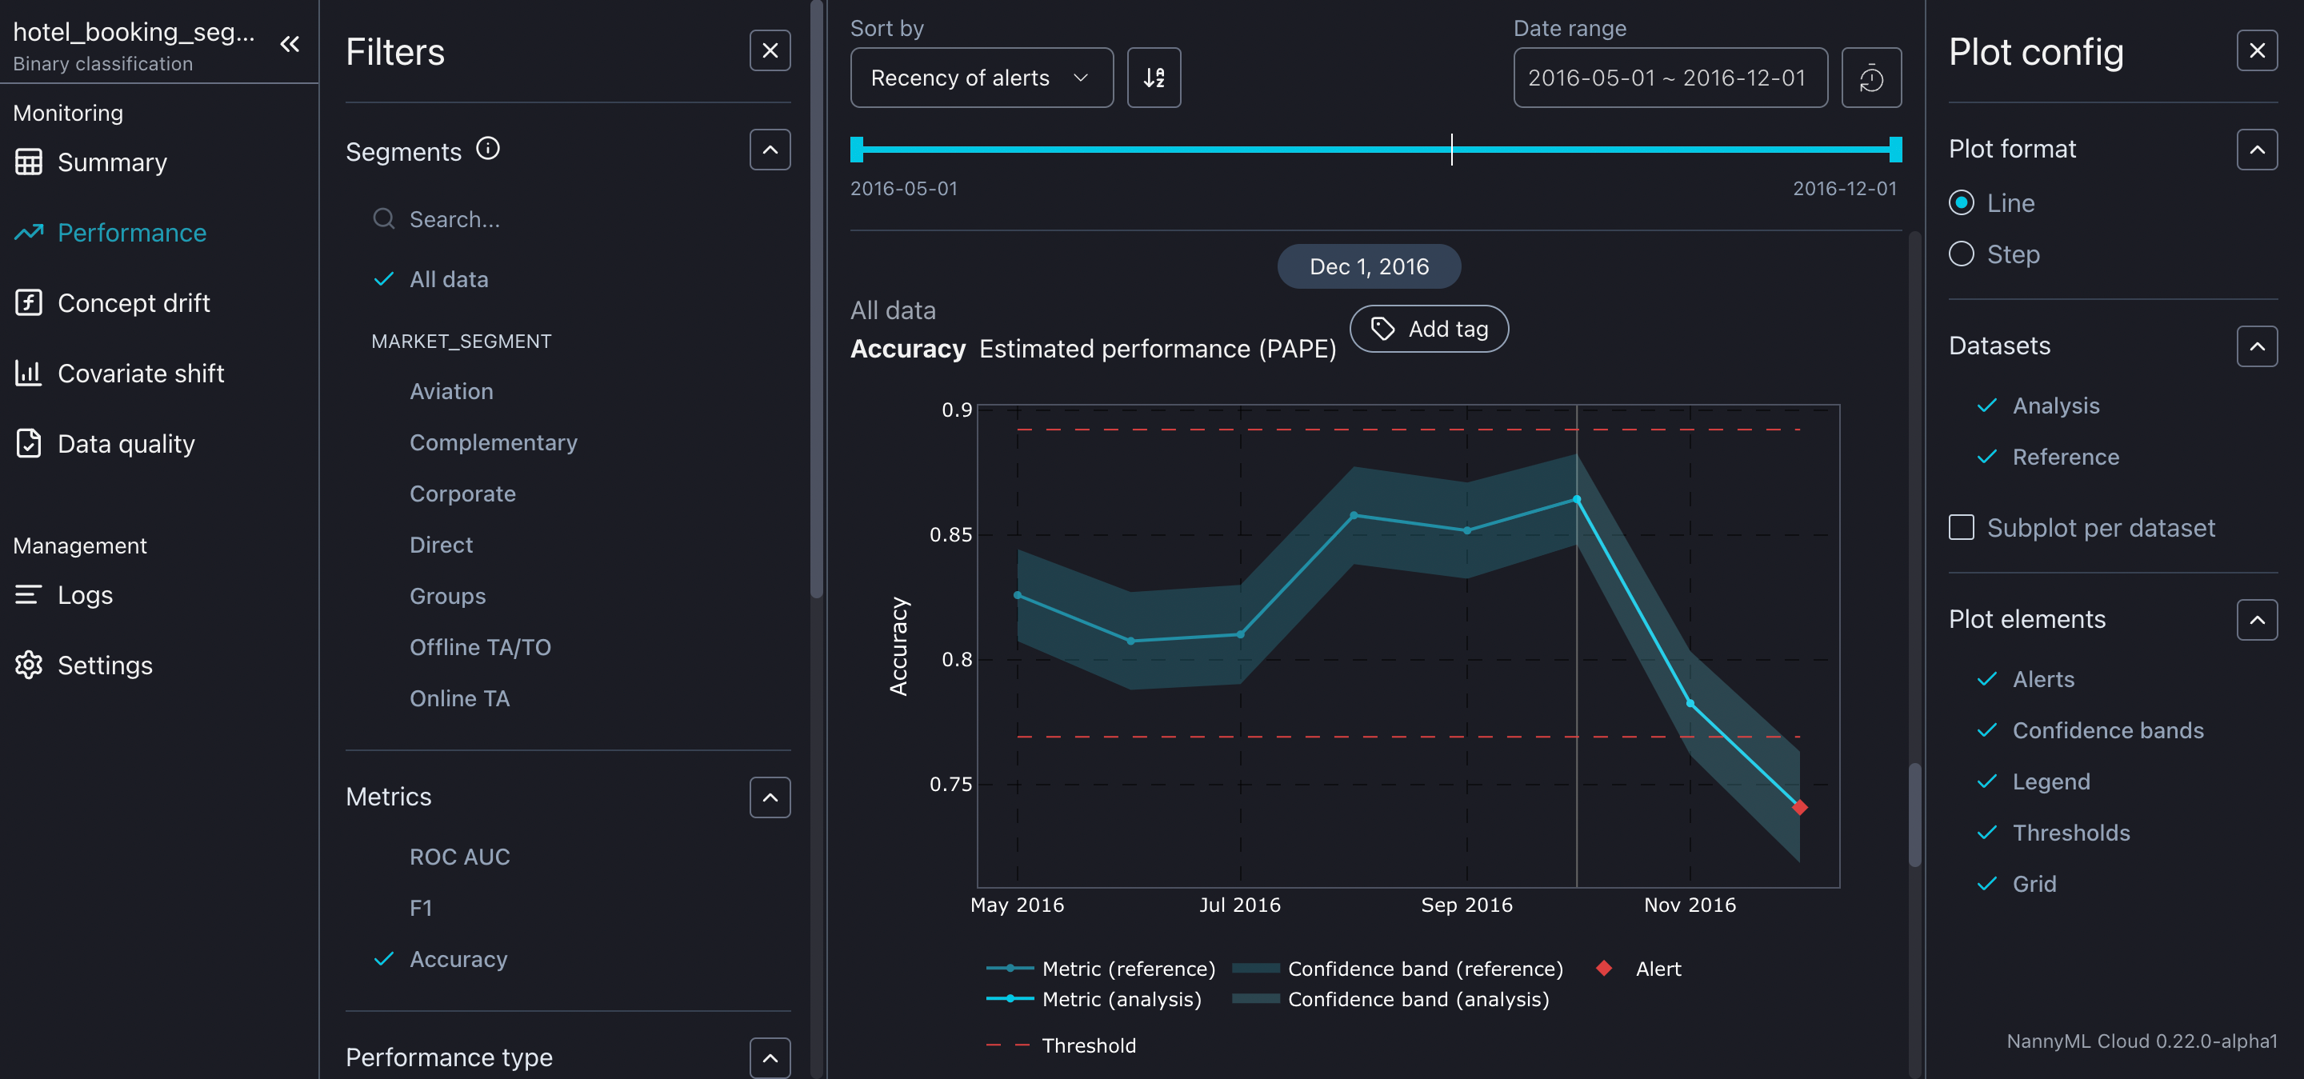
As more data is collected and inferences are made using the model, we observe that the overall estimated performance drops, and the performance estimation on the Groups segment drops even further. This demonstrates that monitoring segments can be a powerful tool for model performance monitoring.
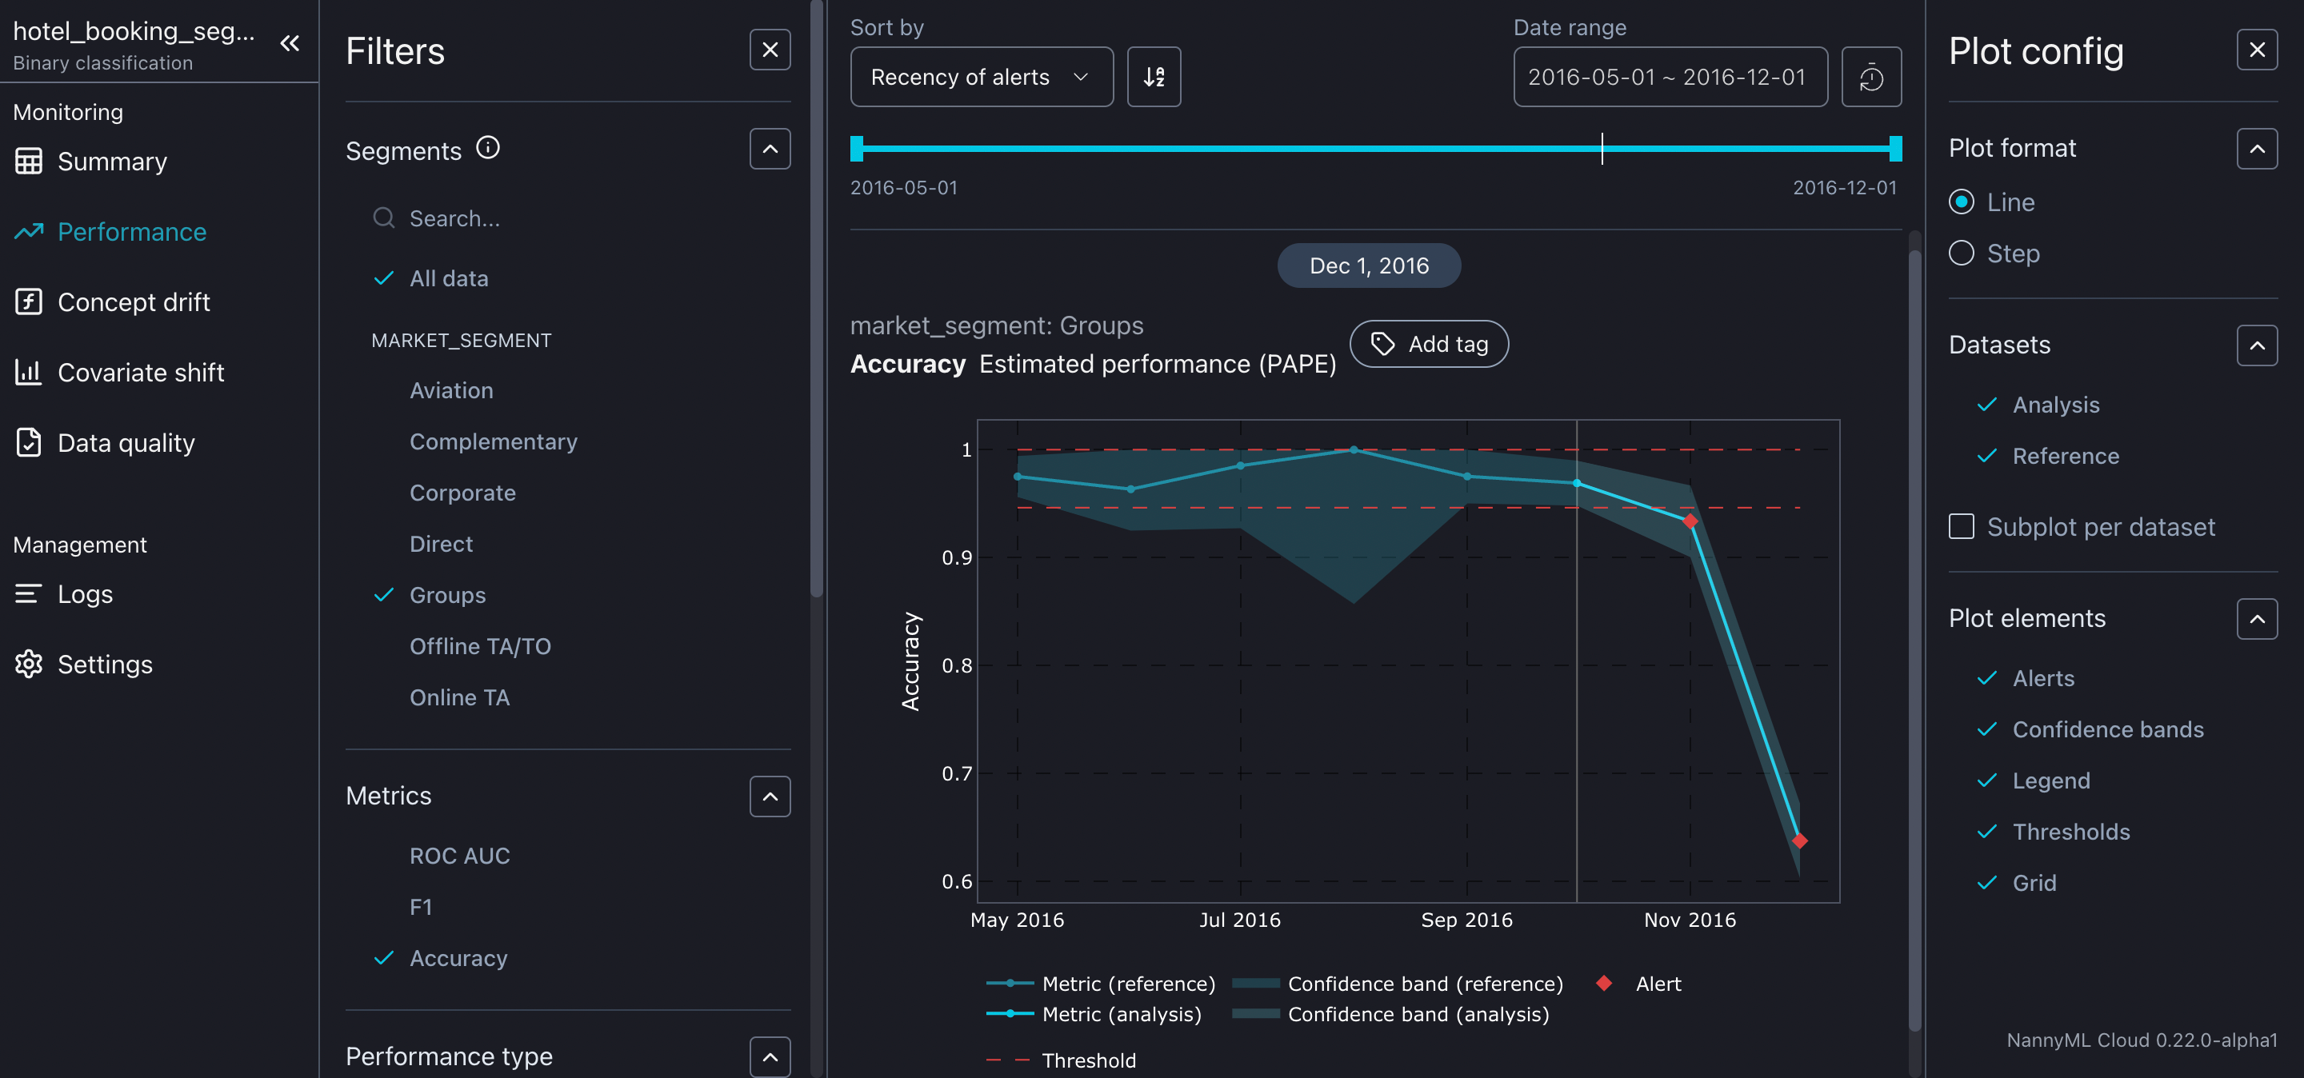
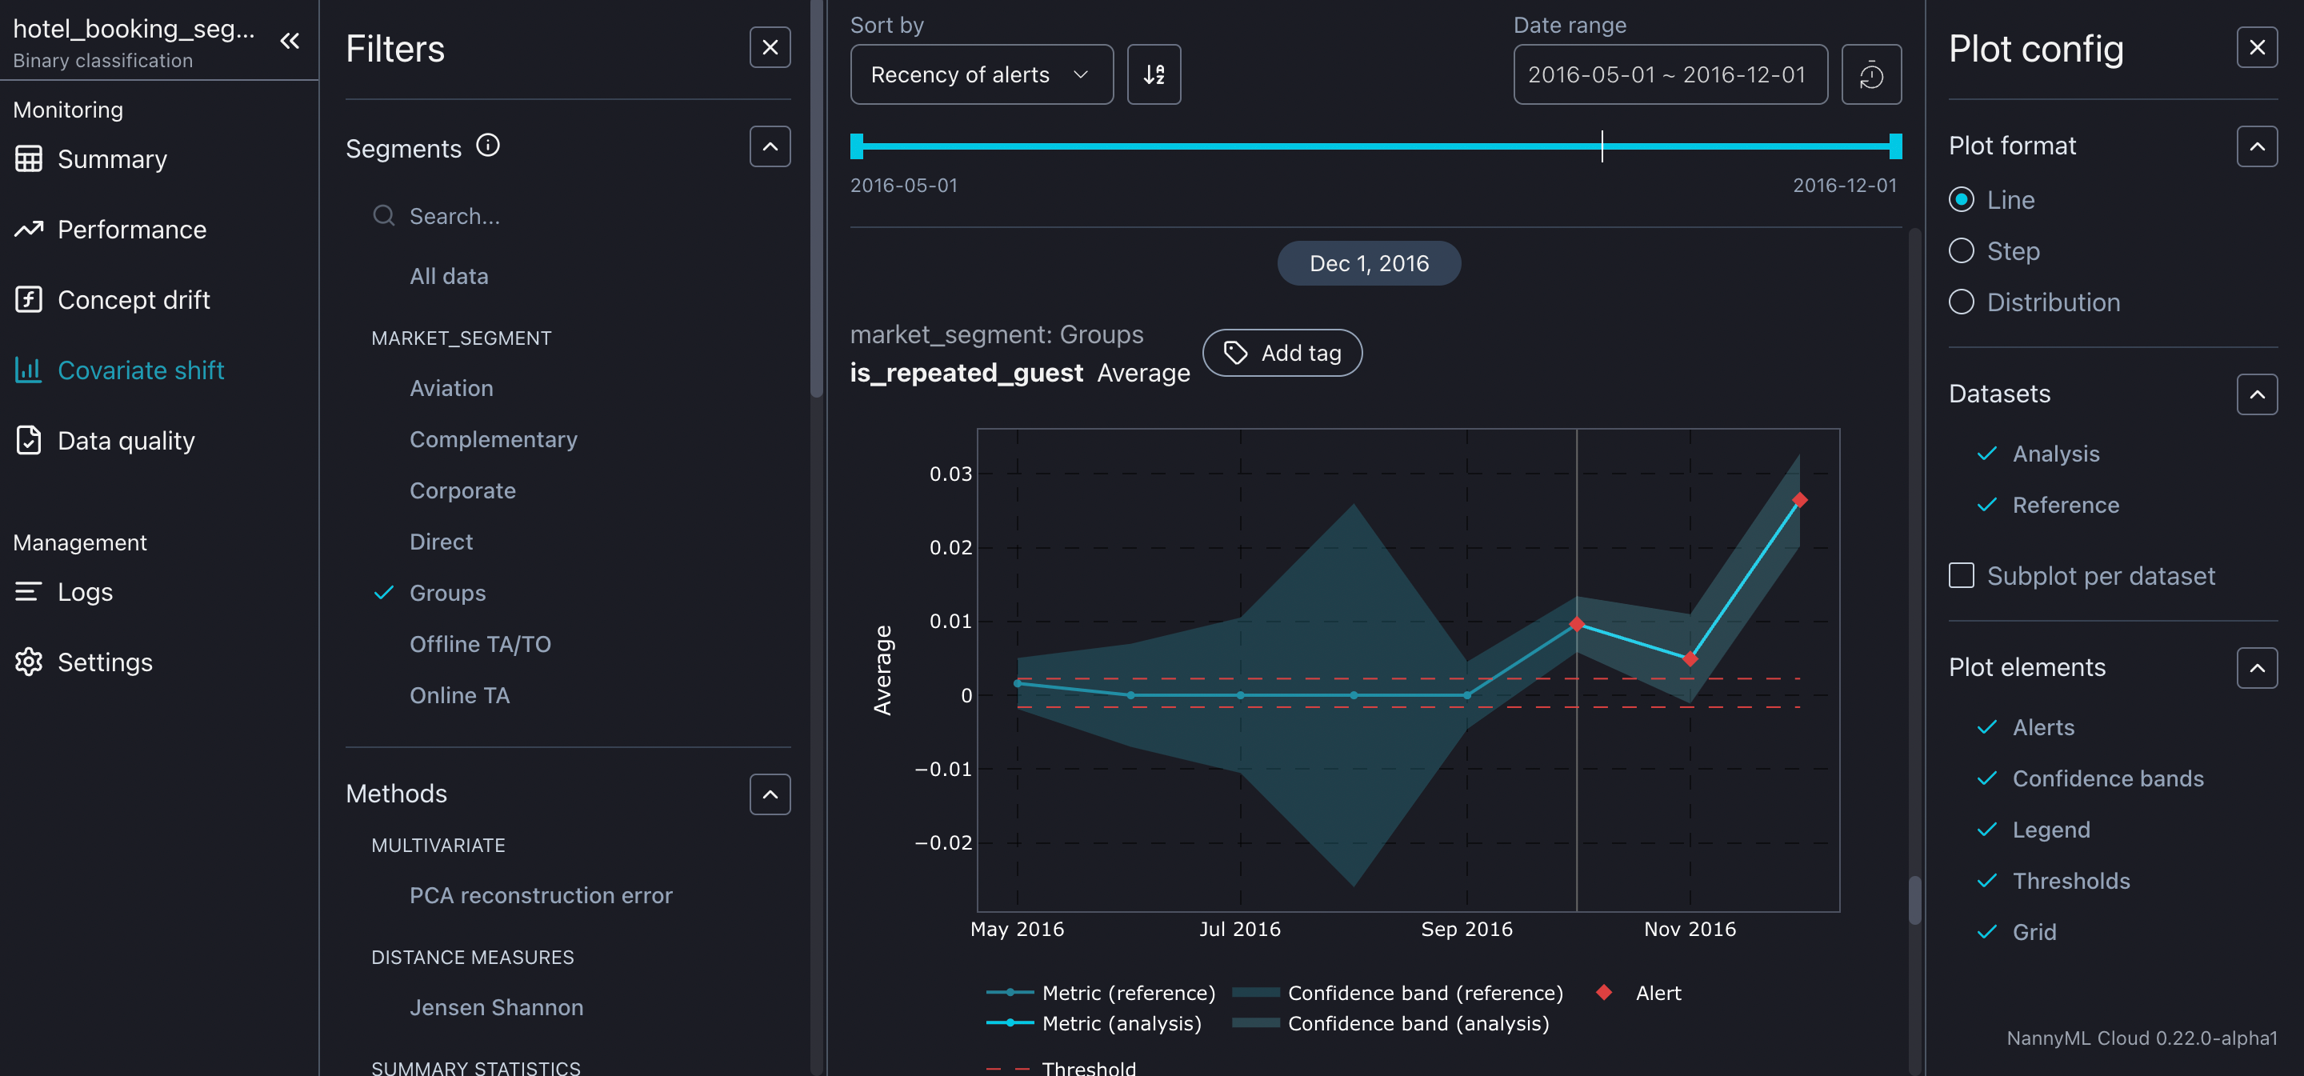
We can then proceed with conducting root cause analysis to understand the drop in performance. We do this by checking for covariate shifts in our data, focusing on the Groups segment. Indeed, we notice that various features have shifted in the group segment. This not only allows us to take the necessary steps to remedy the model but also offers more interpretability. For example, noticing that the repeated_guests feature has drifted for the group segment can provide valuable information that data scientists can communicate to the upstream decision-making teams, offering insights into how many groups tend to return to a hotel.
Limitations of segmentation
As with every method, there are a few caveats that need to be mentioned so that users understand what might limit the performance of a particular tool, in this case, segmentation.
One of the main limitations of segmentation is that segments can also drift. This changes the amount of data in a given segment, which might impact the ability to conduct data analysis on them.
Currently, segments can only be defined by users. That is, distinct groups or subsets created based on predefined criteria or business logic (e.g., segmenting based on geographical regions or purchase frequency). We’re working on transitioning from user-defined segments to regions that are algorithmically detected segments where model performance drops.