NannyML Cloud
HomeBlogNannyML OSS Docs
v0.24.3
v0.24.3
  • ☂️Introduction
  • Model Monitoring
    • Quickstart
    • Data Preparation
      • How to get data ready for NannyML
    • Tutorials
      • Monitoring a tabular data model
      • Monitoring with segmentation
      • Monitoring a text classification model
      • Monitoring a computer vision model
    • How it works
      • Probabilistic Adaptive Performance Estimation (PAPE)
      • Reverse Concept Drift (RCD)
    • Custom Metrics
      • Creating Custom Metrics
        • Writing Functions for Binary Classification
        • Writing Functions for Multiclass Classification
        • Writing Functions for Regression
        • Handling Missing Values
        • Advanced Tutorial: Creating a MTBF Custom Metric
      • Adding a Custom Metric through NannyML SDK
    • Reporting
      • Creating a new report
      • Report structure
      • Exporting a report
      • Managing reports
      • Report template
      • Add to report feature
  • Product tour
    • Navigation
    • Adding a model
    • Model overview
    • Deleting a model
    • Model side panel
      • Summary
      • Performance
      • Concept drift
      • Covariate shift
      • Data quality
      • Logs
      • Model settings
        • General
        • Data
        • Performance settings
        • Concept Drift settings
        • Covariate Shift settings
        • Descriptive Statistics settings
        • Data Quality settings
    • Account settings
  • Deployment
    • Azure
      • Azure Managed Application
        • Finding the URL to access managed NannyML Cloud
        • Enabling access to storage
      • Azure Software-as-a-Service (SaaS)
    • AWS
      • AMI with CFT
        • Architecture
      • EKS
        • Quick start cluster setup
      • S3 Access
    • Application setup
      • Authentication
      • Notifications
      • Webhooks
      • Permissions
  • NannyML Cloud SDK
    • Getting Started
    • Example
      • Authentication & loading data
      • Setting up the model schema
      • Creating the monitoring model
      • Customizing the monitoring model settings
      • Setting up continuous monitoring
      • Add delayed ground truth (optional)
    • API Reference
  • Probabilistic Model Evaluation
    • Introduction
    • Tutorials
      • Evaluating a binary classification model
      • Data Preparation
    • How it works
      • HDI+ROPE (with minimum precision)
      • Getting Probability Distribution of a Performance Metric with targets
      • Getting Probability Distribution of Performance Metric without targets
      • Getting Probability Distribution of Performance Metric when some observations have labels
      • Defaults for ROPE and estimation precision
  • Experiments Module
    • Introduction
    • Tutorials
      • Running an A/B test
      • Data Preparation
    • How it works
      • Getting probability distribution of the difference of binary downstream metrics
  • miscellaneous
    • Engineering
    • Usage logging in NannyNL
    • Versions
      • Version 0.24.3
      • Version 0.24.2
      • Version 0.24.1
      • Version 0.24.0
      • Version 0.23.0
      • Version 0.22.0
      • Version 0.21.0
Powered by GitBook
On this page
  1. Product tour
  2. Model side panel
  3. Model settings

Data

PreviousGeneralNextPerformance settings

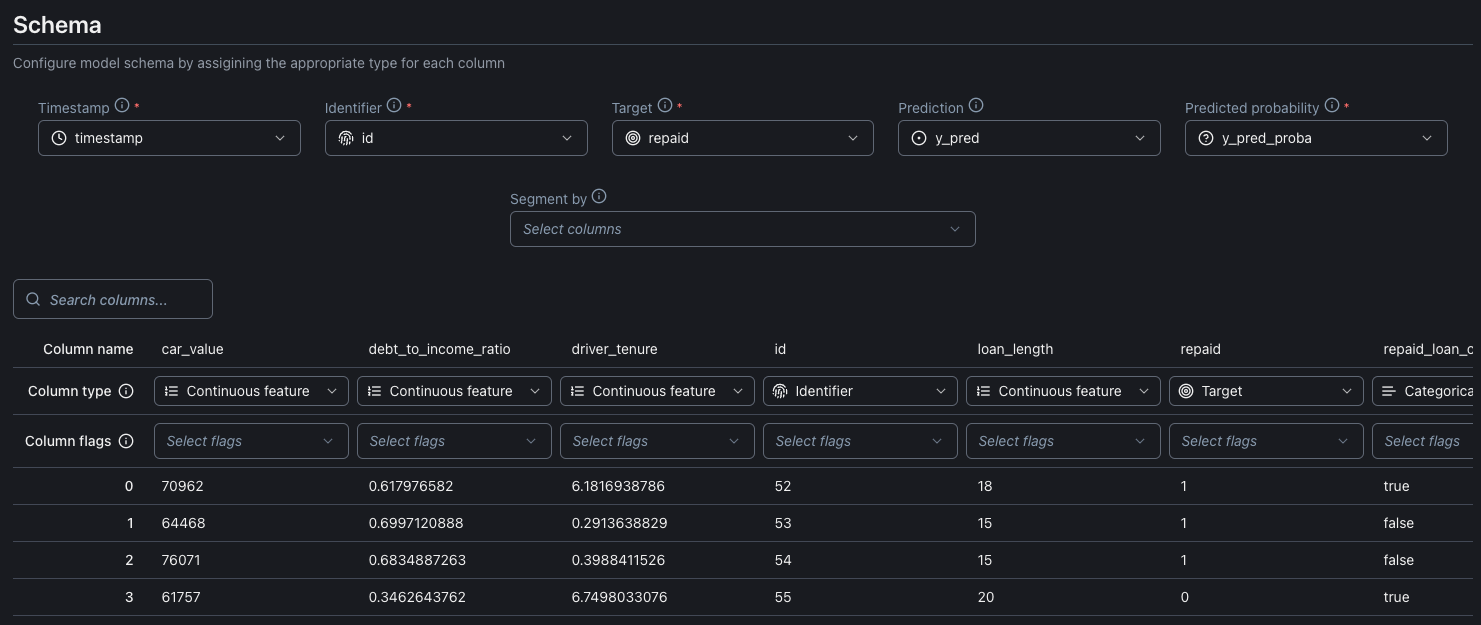
Schema

On Data settings page you can configure or change the configuration for the table schema for the model's dataset. Here it is possible to point on the dataset schema the mandatory NannyML data like:

  • Timestamp: The date and time the prediction was made.

  • Identifier: Unique identifier for each row on the dataset.

  • Target: The actual outcome of what your model predicted.

  • Predicted probability: The probabilities assigned by a machine learning model regarding the chance that a positive event materializes

It is possible also to point columns on the dataset schema for non mandatory NannyML data like:

  • Prediction: The prediction made by the model.

  • Segmented by: Segmentation allows you to split your data into groups and analyze them separately

You can find more information about the meaning of the mandatory and non mandatory information on the NannyML Cloud by clicking the info icon beside the information label.

Segmentation allows you to split your data into groups and analyze them separately. Each segmentation column provides a separate group of segments that are not combined.

For example having 'gender' and 'region' as segmentation columns might result in 'gender: male', 'gender: female' and 'region: US' segments but there won't be a 'female-US' segment. If you want to analyze combined segments, you should create a new column that combines the segments you want to analyze together.

It is also possible to assign the columns on the schema dataset to the NannyML Cloud information directly from the table view.

Each column can have a special Column flag field. Right now it is possible to use this field to add segmentation to the columns.

Data Sources

Under datasets, you can manually add more analysis and target data.
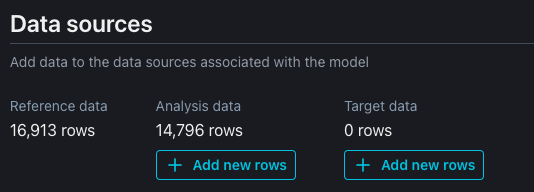
The new datasets can be imported from:

  • Azure blob storage

  • Local file (the maximum size for the file is 200MB)

  • Public link

  • Amazon S3

New datasets can also be imported using NannyML SDK. Check out the documentation .

here